Reverse Mortgage Activity vs Senior Homeowners by State
Demographics
Mortgage Markets
Reverse mortgage scatter plot
Chart Download and Page Share

Share or Download

Data Points
Reporting period | 2025 HMDA originations | Denominator: ACS 2024 1-year PUMS National reverse originations | 31,829 | YoY +14.25% Originations in the 50 states and DC | 31,826 Owner households age 62 and over | 35,455,232 Property value held by those households | $16.5 trillion Of those households, mortgage-free | 21,658,536 | 61.1% National rate | 9 reverse originations per 10,000 senior owner households | exact 8.98 States above the national rate | 13 | 31.0% of senior owner households | 57.8% of originations States below the national rate | 38 | 69.0% of senior owner households | $8.9 trillion in senior-owned property Region | Senior owner households | Originations | Per 10,000 | Avg senior-owned home value West | 7,507,958 | 14,742 | 19.6 | $753,832 South | 13,960,956 | 10,298 | 7.4 | $387,252 Northeast | 6,069,159 | 3,836 | 6.3 | $506,012 Midwest | 7,917,159 | 2,950 | 3.7 | $293,037 Highest rate | Utah | 32.7 | California 22.5 | Colorado 22.4 | Nevada 21.6 | Idaho 21.1 Lowest rate | West Virginia | 1.9 | North Dakota 2.0 | Mississippi 2.1 | Iowa 2.2 | Louisiana 2.6 Largest states below the line | New York 4.1 | Pennsylvania 4.6 | Ohio 4.0 | Illinois 3.4 | Michigan 4.1 Texas | 2,532,581 senior owner households | 2,131 originations | 8.4 per 10,000 Florida | 2,941,376 senior owner households | 2,954 originations | 10.0 per 10,000 2025 borrower averages | Property value $755,579 | Initial principal limit $303,079 | Principal limit factor 40.1% 2025 borrower averages | Applicant income $39,437 | Interest rate 6.791% | Active lenders 88 2025 production volume | $9.6 billion in initial principal limit | 0.06% of senior-owned property value Borrower age | 75+ 16,489 | 65-74 12,680 | 55-64 2,579 Regulatory note | Reverse mortgages excluded from HOEPA high-cost coverage | 12 CFR 1026.32(a)(2)
Which states have the most reverse mortgage activity?
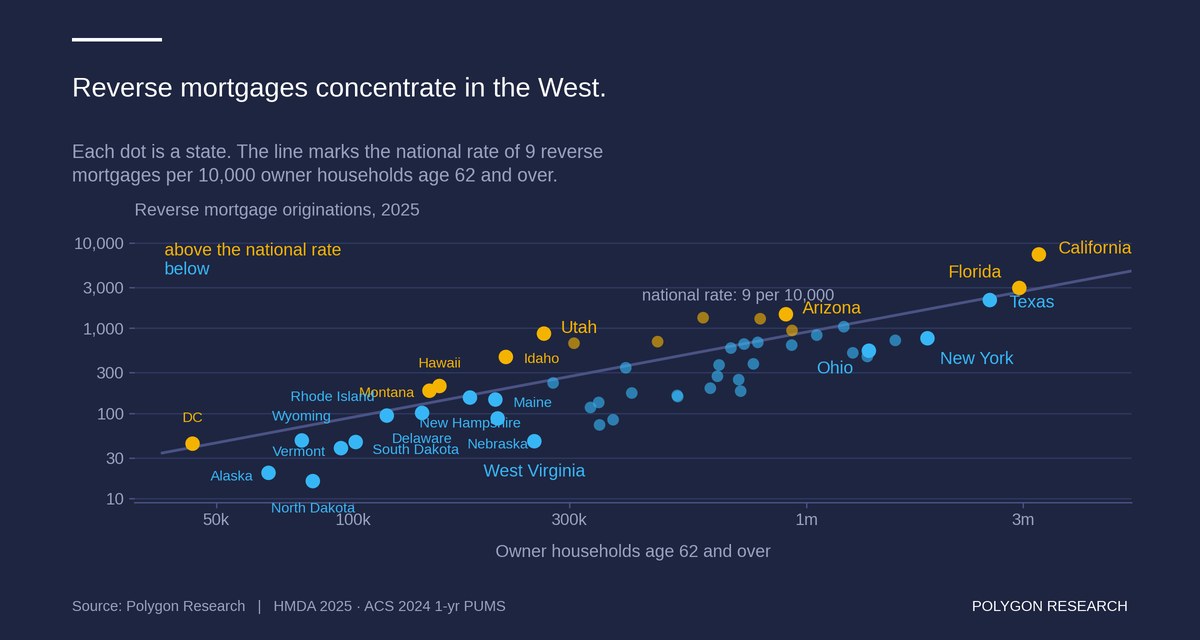
Utah leads at 32.7 reverse mortgages per 10,000 owner households age 62 and over, against a national rate of 9. West Virginia is lowest at 1.9.
Date Published:
August 21, 2026
Date Updated:
August 21, 2026
Chart type:
Scatterplot
Suggested Citation:
Polygon Research, "Reverse Mortgage Originations vs Owner Households Age 62 and Over by State, 2025," Polygon Vision - HMDAVision and CensusVision, published August 21, 2026. Data: HMDA 2025 originations filtered to action type originations and reverse mortgage yes; ACS 2024 1-year PUMS owner households age 62 and over. Scope: 50 states and the District of Columbia; n=31,826 originations against 35,455,232 senior owner households. Metric: reverse mortgage originations per 10,000 owner households age 62 and over. Accessed August 21, 2026.
Key insights

Thirteen states originate reverse mortgages above the national rate of 9 per 10,000 owner households age 62 and over. Those states hold 31% of the country's senior homeowners and account for 58% of the loans.

The gap follows home value. Activity runs at 19.6 per 10,000 senior owner households in the West, 7.4 in the South, 6.3 in the Northeast and 3.7 in the Midwest. Utah leads at 32.7 and West Virginia trails at 1.9. The average Western senior owns a home worth $753,832. The average reverse borrower's home is worth $755,579. Those two figures sit within a quarter of one percent of each other, which is most of the explanation for the map.

The addressable market is far larger than the production. CensusVision counts 35.5 million owner households age 62 and over holding $16.5 trillion in property value, 21.7 million of them carrying no mortgage. The 31,829 reverse mortgages originated in 2025 carried $9.6 billion in initial principal limit, six hundredths of one percent of that value.

The borrower profile explains the underwriting. Average property value $755,579, average initial principal limit $303,079 or 40.1% of value, average applicant income $39,437, average interest rate 6.791%, across 88 active lenders. That is nineteen dollars of house for every dollar of annual income.

Reverse mortgages are excluded from HOEPA high-cost coverage under 12 CFR 1026.32(a)(2). See what makes a mortgage high cost, or explore reverse mortgage lending in HMDAVision.

From Analysis to Action

This analysis provides a clear blueprint for how to uncover meaningful market dynamics. Its true power is unleashed when you apply this same methodology to your own local markets. Because all real estate is local, this granular approach is essential for crafting precise strategies that effectively address the unique conditions of each community.

Ready to Continue? Get Your Exact Market Answers.

Go beyond generic insights. Polygon's interactive tools and limitless filtering empower you to tailor market data to your specific strategy.
Start your 7-day free trial.
Unlock My Custom Insights Now - Free Trial