

Agency adjustable-rate mortgages (ARMs) are returning to relevance in a mortgage market defined by elevated rates, high home prices and continued affordability pressure.
Agency ARM market share increased from 0.31% in 2021 to 3.34% YTD 2026. Independent mortgage banks (IMBs) now occupy every position among the 10 largest agency ARM seller/issuers. The borrowers using these loans have also changed: average credit scores are lower, while leverage and debt-to-income ratios are considerably higher.
These shifts tell a larger story about who is bringing ARMs to market, who is using them and the role adjustable-rate mortgages are beginning to play in today’s housing finance system.
Data source: Polygon Research, Polygon Pulse (MBS Pivot). The analysis covers agency loans represented in Fannie Mae, Freddie Mac and Ginnie Mae mortgage-backed securities data. Seller/issuer rankings are based on ARM loan count. YTD 2026 data is through May 2026.
Three findings define the current agency ARM market:
Agency ARMs remain a relatively small part of the overall market. Their position within the agency product mix has changed substantially.
Download the Agency ARMs Market Share Chart.
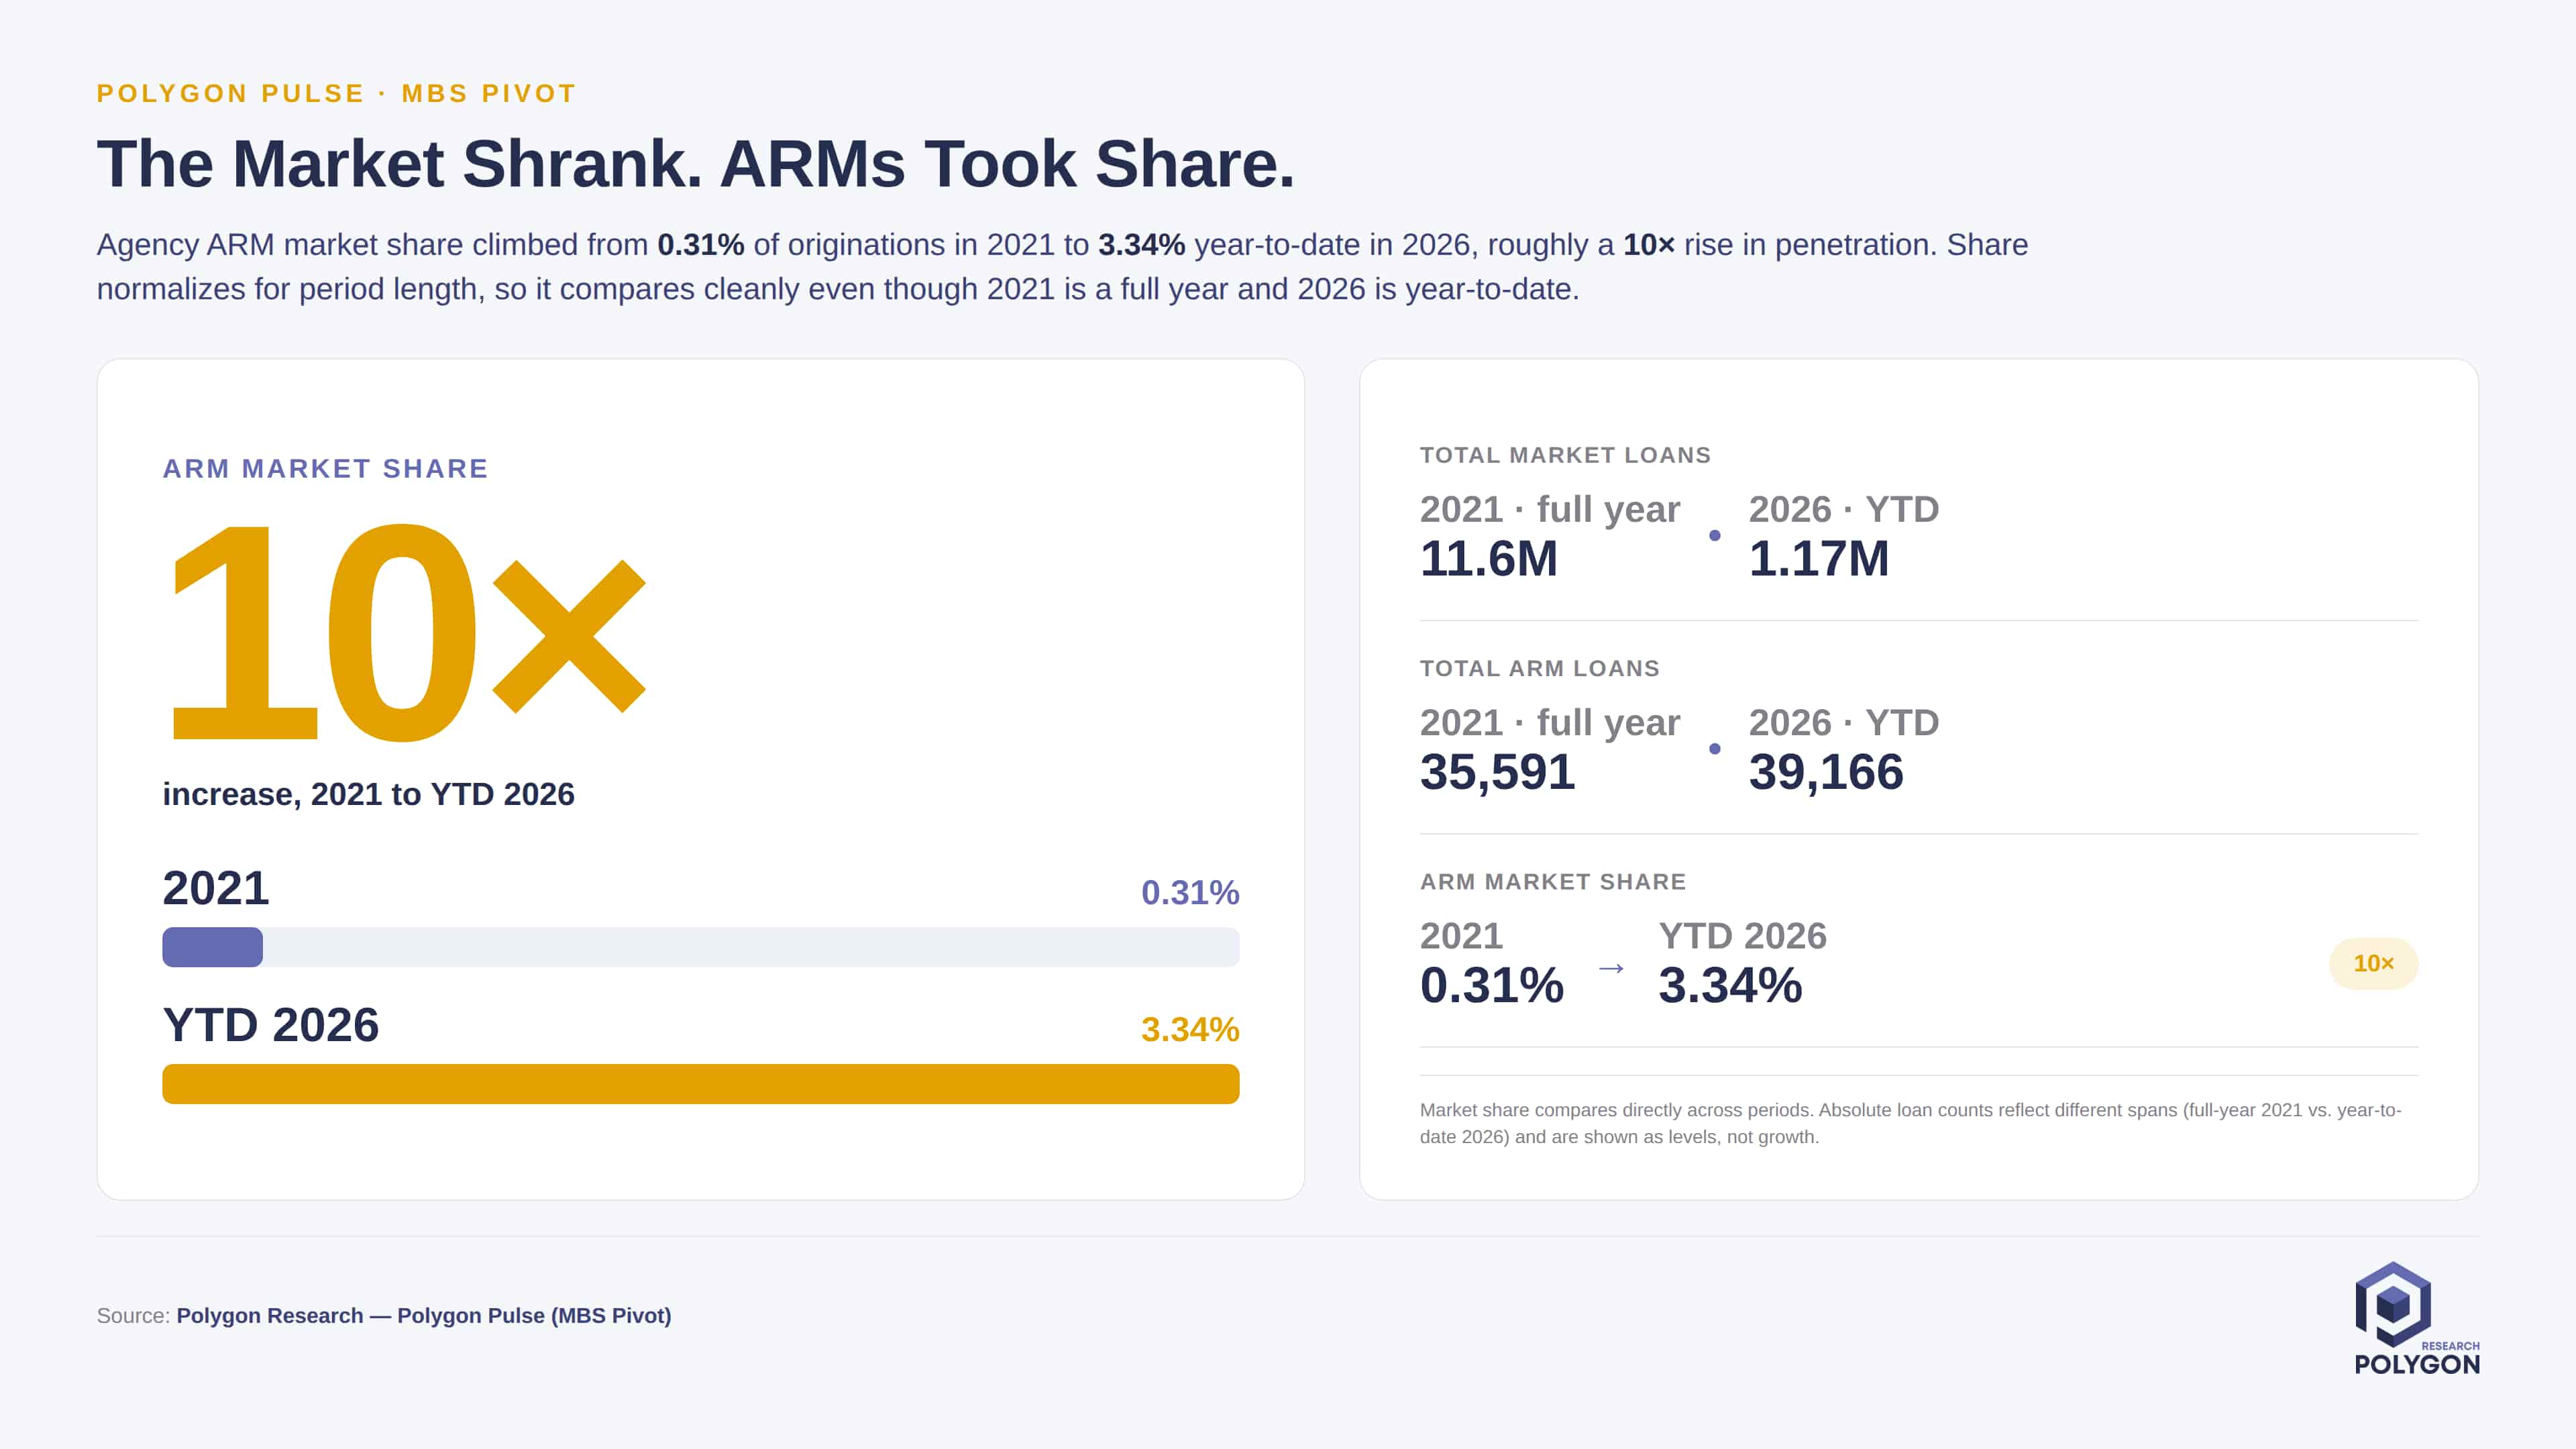
Agency ARMs accounted for just 0.31% of agency mortgage loans in 2021. By YTD 2026, their share had climbed to 3.34%.
The shift is especially notable because the mortgage environment is very different from the low-rate market of 2021. Borrowers now face a combination of higher monthly payments and home prices that remain elevated in many markets.
An adjustable-rate mortgage may offer a lower initial interest rate than a comparable fixed-rate mortgage, depending on pricing and loan terms. That lower starting rate can reduce the initial payment, improve qualification or allow a borrower to preserve more monthly cash flow.
The increase in market share shows a trend of ARMs gaining relevance as lenders and borrowers look for ways to manage the initial cost of homeownership.
ARM usage also varies widely by geography. Our earlier state-level adjustable-rate mortgage analysis found greater ARM penetration in several expensive housing markets where the difference between fixed and adjustable rates can have a larger effect on the monthly payment.
The renewed use of adjustable-rate mortgages brings back a debate that was already underway before the housing crisis.
In February 2004, Federal Reserve Chairman Alan Greenspan argued that many homeowners might have saved tens of thousands of dollars by choosing adjustable-rate mortgages rather than fixed-rate loans during the preceding decade.
His reasoning was straightforward. A 30-year fixed-rate borrower pays for long-term payment certainty and protection from rising interest rates. Borrowers with the capacity to manage interest-rate risk could potentially avoid some of that cost by choosing an ARM.
Greenspan also recognized the limitation of the argument. Those savings would have looked very different if interest rates had risen sharply.
By July 2005, his tone had become more cautious. Greenspan identified the rising prevalence of interest-only loans and more exotic adjustable-rate mortgage structures as a particular concern, even while acknowledging that such products could have appropriate uses.
That progression captures the central tension surrounding ARMs.
A lower initial rate can help a borrower manage the cost of purchasing a home. The borrower’s leverage, debt obligations, product terms and ability to absorb a future payment increase determine how much risk accompanies that benefit.
Today’s agency ARMs differ from the option ARMs and private-label products associated with the years before the financial crisis. The loans in this analysis entered Fannie Mae, Freddie Mac or Ginnie Mae securities and operate within current agency and government mortgage frameworks.
The historical lesson remains relevant: the value of an ARM depends on more than the starting rate. The borrower’s financial cushion and the structure of the loan matter just as much.

The institutions leading the agency ARM market have changed dramatically since 2021. Five banks appeared among the 10 largest agency ARM seller/issuers in 2021:
Wells Fargo led the market with 6,013 agency ARMs. By YTD 2026, no depository institution remained in the top 10. Every position was held by an independent mortgage bank or other non-depository mortgage company.
Who are the top agency ARM lenders in 2026?
The leading agency ARM seller/issuers in YTD 2026 are:
Download the Agency ARM Lender Rankings Chart.
The change reflects a broader transformation in agency mortgage production and distribution.
Many IMBs operate across retail, wholesale and correspondent channels. Their centralized product, pricing and distribution capabilities can help them respond quickly when a product becomes more relevant to originators and borrowers.
The YTD 2026 rankings show that IMBs have become the principal institutions bringing adjustable-rate mortgages into the agency secondary market.
For banks and credit unions, the rankings provide a competitive signal. ARM demand has not disappeared. Much of the current activity has shifted toward nonbank lenders that have incorporated the product into their broader affordability and origination strategies.
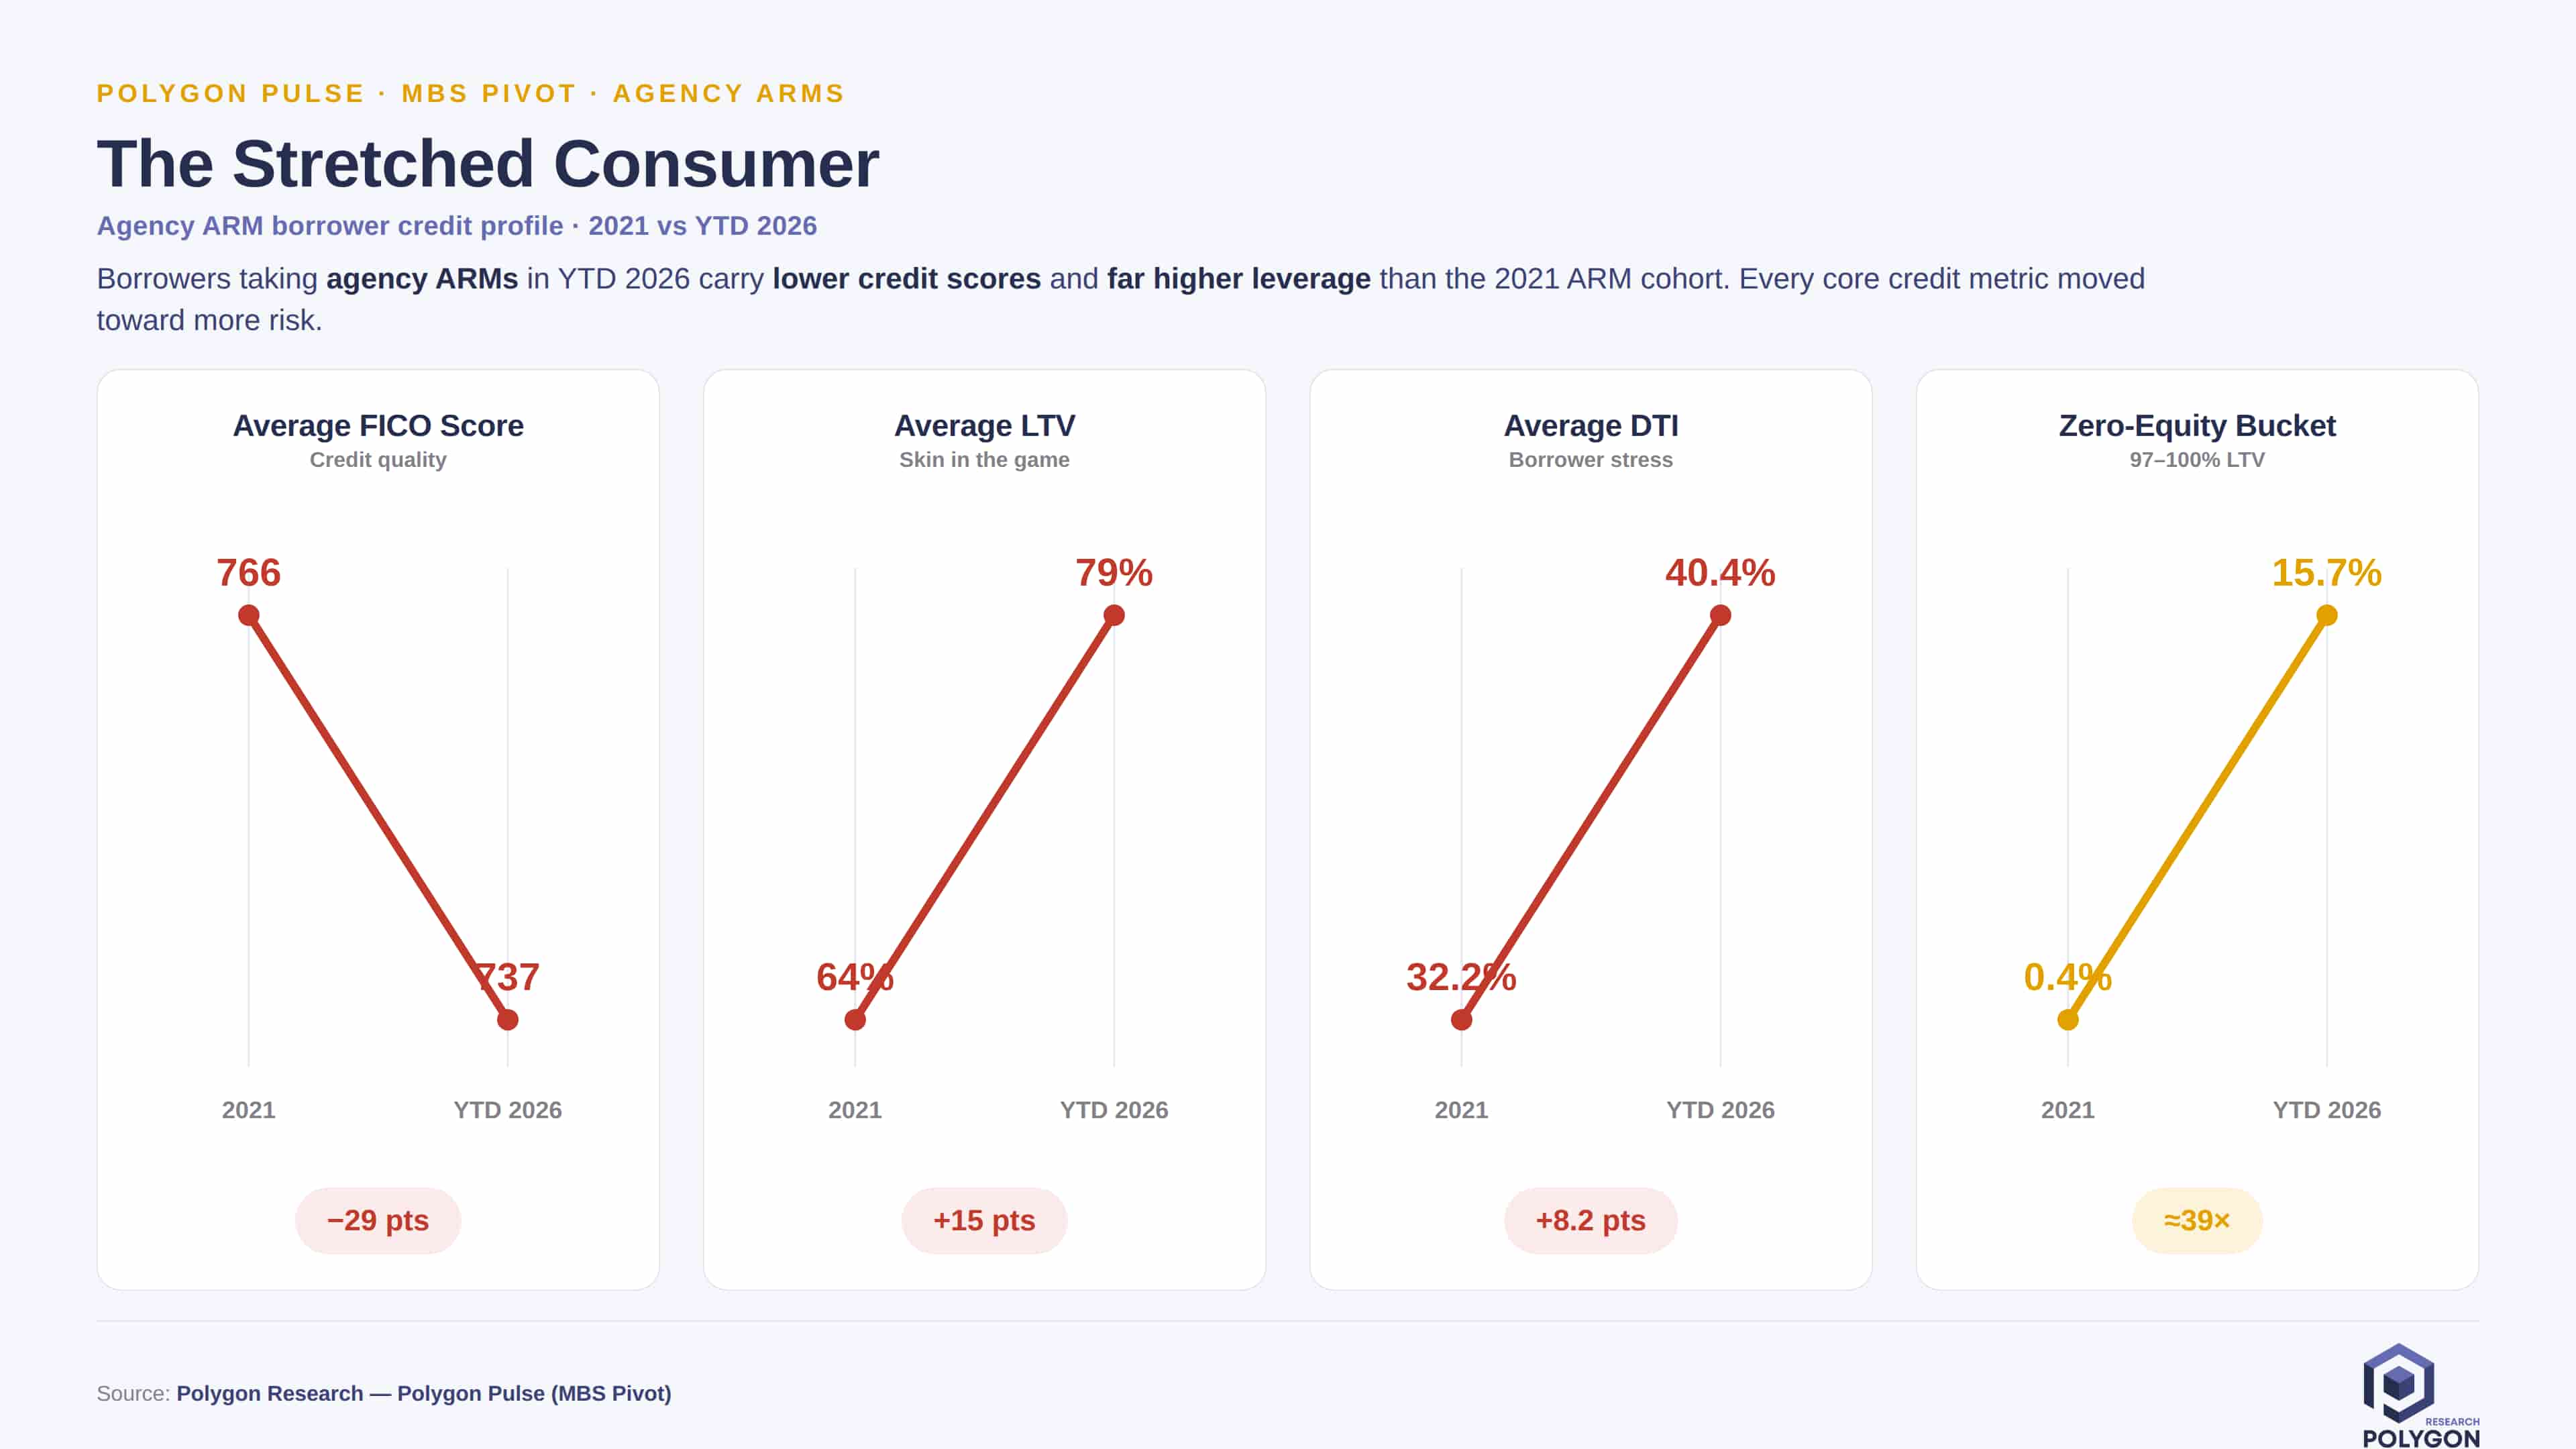
The change in lender leadership is significant. The change in the borrower profile may be even more consequential. Across four core credit measures, the YTD 2026 agency ARM borrower has less financial cushion than the 2021 borrower.
Download the Agency ARM Borrower Credit Profile
The average FICO score for an agency ARM borrower fell by 29 points between 2021 and YTD 2026.
An average score of 737 still reflects a generally strong credit profile. The decline shows that agency ARM usage has expanded beyond the exceptionally high-credit borrower population represented in the 2021 data.
The average loan-to-value ratio increased by 15 percentage points.
The average 2021 borrower entered with approximately 36% equity. The average YTD 2026 borrower entered with approximately 21%.
The current borrower therefore has a smaller equity cushion at origination.
Average debt-to-income ratio rose by 8.2 percentage points.
The change indicates that current ARM borrowers are committing a greater portion of their monthly income to debt obligations. It also supports the view that the lower initial payment is becoming more important in borrower qualification and product selection.
The largest shift appears among borrowers entering the mortgage market with little or no equity.
In 2021, only 0.4% of agency ARMs had LTV ratios between 97% and 100%. In YTD 2026, that share reached 15.7%.
The proportion is approximately 39 times higher than it was in 2021.
High LTV does not determine whether a loan will perform. It does reduce the borrower’s initial equity cushion. When high leverage is combined with a higher DTI and the possibility of a future rate adjustment, the loan deserves closer monitoring.
The data points to three connected forces.
Elevated rates and home prices have increased the monthly cost of purchasing a home. A lower initial ARM rate can improve qualification or reduce the early payment burden.
For some borrowers, the decision may rest on an expectation that they will refinance, sell the property or increase their income before the first adjustment. Each of those outcomes carries uncertainty.
Independent mortgage banks have taken the leading positions in agency ARM production.
Their presence across multiple origination channels can help them introduce ARM products quickly, reach a broad set of loan officers and brokers, and respond to changes in borrower demand.
The movement in FICO, LTV and DTI shows that agency ARM usage has expanded into a more leveraged segment of the market.
ARMs appear to be serving more borrowers for whom the initial payment carries considerable weight in the mortgage decision.
Today’s agency ARM market should not be equated with the full range of nontraditional mortgage products offered before the financial crisis.
The loans covered in this analysis entered agency or government mortgage-backed securities. They are distinct from the private-label option ARMs, negative-amortization products and loosely underwritten loans frequently associated with the pre-crisis market.
Product structure still matters.
ARM borrowers and loan officers should understand:
The current credit profile adds another layer to that evaluation. Compared with 2021, today’s agency ARM borrowers have higher leverage, greater debt burdens and less equity protection.
Lenders should examine ARM production by FICO, LTV, DTI, geography, loan purpose, loan type, occupancy and channel.
Averages provide a directional view. The concentration of loans across several risk characteristics can reveal more than any single measure.
Borrowers need a clear explanation of how the loan can change after the introductory period. The discussion should cover the initial rate, adjustment schedule, index, margin, caps and possible future payment. A borrower choosing an ARM to solve an immediate affordability problem also needs to understand the longer-term obligation.
Banks and credit unions should evaluate why IMBs now dominate the top agency ARM rankings. Useful questions include:
The charts in this analysis describe origination characteristics. They do not measure delinquency, default, prepayment or long-term borrower outcomes. The shift toward lower FICO, higher LTV and higher DTI is an early credit-profile signal. Performance analysis will show whether that movement translates into different outcomes over time.
The agency ARM market has entered a different phase.
ARM share has increased tenfold since 2021. IMBs now hold every position among the 10 largest agency ARM seller/issuers. The average borrower has a lower credit score, higher leverage and a higher debt-to-income ratio.
These findings do not establish that an ARM is unsuitable for a particular borrower. They show that ARMs are increasingly being used in circumstances where affordability, qualification and financial flexibility carry more weight.
For lenders, that creates a product opportunity. It also increases the importance of underwriting, borrower education, product design and performance monitoring.
The agency ARM comeback deserves attention because of who is leading it and who is borrowing.
Explore agency ARM production by lender, geography, loan purpose, channel and borrower profile in MBS Pivot, Polygon Research’s loan-level agency mortgage intelligence platform.
Agency ARM share rose from 0.31% in 2021 to 3.34% YTD 2026. See which lenders lead and how borrower FICO, LTV and DTI have shifted.
Agency adjustable-rate mortgages (ARMs) are returning to relevance in a mortgage market defined by elevated rates, high home prices and continued affordability pressure.
Agency ARM market share increased from 0.31% in 2021 to 3.34% YTD 2026. Independent mortgage banks (IMBs) now occupy every position among the 10 largest agency ARM seller/issuers. The borrowers using these loans have also changed: average credit scores are lower, while leverage and debt-to-income ratios are considerably higher.
These shifts tell a larger story about who is bringing ARMs to market, who is using them and the role adjustable-rate mortgages are beginning to play in today’s housing finance system.
Data source: Polygon Research, Polygon Pulse (MBS Pivot). The analysis covers agency loans represented in Fannie Mae, Freddie Mac and Ginnie Mae mortgage-backed securities data. Seller/issuer rankings are based on ARM loan count. YTD 2026 data is through May 2026.
Three findings define the current agency ARM market:
Agency ARMs remain a relatively small part of the overall market. Their position within the agency product mix has changed substantially.
Download the Agency ARMs Market Share Chart.
Agency ARMs accounted for just 0.31% of agency mortgage loans in 2021. By YTD 2026, their share had climbed to 3.34%.
The shift is especially notable because the mortgage environment is very different from the low-rate market of 2021. Borrowers now face a combination of higher monthly payments and home prices that remain elevated in many markets.
An adjustable-rate mortgage may offer a lower initial interest rate than a comparable fixed-rate mortgage, depending on pricing and loan terms. That lower starting rate can reduce the initial payment, improve qualification or allow a borrower to preserve more monthly cash flow.
The increase in market share shows a trend of ARMs gaining relevance as lenders and borrowers look for ways to manage the initial cost of homeownership.
ARM usage also varies widely by geography. Our earlier state-level adjustable-rate mortgage analysis found greater ARM penetration in several expensive housing markets where the difference between fixed and adjustable rates can have a larger effect on the monthly payment.
The renewed use of adjustable-rate mortgages brings back a debate that was already underway before the housing crisis.
In February 2004, Federal Reserve Chairman Alan Greenspan argued that many homeowners might have saved tens of thousands of dollars by choosing adjustable-rate mortgages rather than fixed-rate loans during the preceding decade.
His reasoning was straightforward. A 30-year fixed-rate borrower pays for long-term payment certainty and protection from rising interest rates. Borrowers with the capacity to manage interest-rate risk could potentially avoid some of that cost by choosing an ARM.
Greenspan also recognized the limitation of the argument. Those savings would have looked very different if interest rates had risen sharply.
By July 2005, his tone had become more cautious. Greenspan identified the rising prevalence of interest-only loans and more exotic adjustable-rate mortgage structures as a particular concern, even while acknowledging that such products could have appropriate uses.
That progression captures the central tension surrounding ARMs.
A lower initial rate can help a borrower manage the cost of purchasing a home. The borrower’s leverage, debt obligations, product terms and ability to absorb a future payment increase determine how much risk accompanies that benefit.
Today’s agency ARMs differ from the option ARMs and private-label products associated with the years before the financial crisis. The loans in this analysis entered Fannie Mae, Freddie Mac or Ginnie Mae securities and operate within current agency and government mortgage frameworks.
The historical lesson remains relevant: the value of an ARM depends on more than the starting rate. The borrower’s financial cushion and the structure of the loan matter just as much.
The institutions leading the agency ARM market have changed dramatically since 2021. Five banks appeared among the 10 largest agency ARM seller/issuers in 2021:
Wells Fargo led the market with 6,013 agency ARMs. By YTD 2026, no depository institution remained in the top 10. Every position was held by an independent mortgage bank or other non-depository mortgage company.
Who are the top agency ARM lenders in 2026?
The leading agency ARM seller/issuers in YTD 2026 are:
Download the Agency ARM Lender Rankings Chart.
The change reflects a broader transformation in agency mortgage production and distribution.
Many IMBs operate across retail, wholesale and correspondent channels. Their centralized product, pricing and distribution capabilities can help them respond quickly when a product becomes more relevant to originators and borrowers.
The YTD 2026 rankings show that IMBs have become the principal institutions bringing adjustable-rate mortgages into the agency secondary market.
For banks and credit unions, the rankings provide a competitive signal. ARM demand has not disappeared. Much of the current activity has shifted toward nonbank lenders that have incorporated the product into their broader affordability and origination strategies.
The change in lender leadership is significant. The change in the borrower profile may be even more consequential. Across four core credit measures, the YTD 2026 agency ARM borrower has less financial cushion than the 2021 borrower.
Download the Agency ARM Borrower Credit Profile
The average FICO score for an agency ARM borrower fell by 29 points between 2021 and YTD 2026.
An average score of 737 still reflects a generally strong credit profile. The decline shows that agency ARM usage has expanded beyond the exceptionally high-credit borrower population represented in the 2021 data.
The average loan-to-value ratio increased by 15 percentage points.
The average 2021 borrower entered with approximately 36% equity. The average YTD 2026 borrower entered with approximately 21%.
The current borrower therefore has a smaller equity cushion at origination.
Average debt-to-income ratio rose by 8.2 percentage points.
The change indicates that current ARM borrowers are committing a greater portion of their monthly income to debt obligations. It also supports the view that the lower initial payment is becoming more important in borrower qualification and product selection.
The largest shift appears among borrowers entering the mortgage market with little or no equity.
In 2021, only 0.4% of agency ARMs had LTV ratios between 97% and 100%. In YTD 2026, that share reached 15.7%.
The proportion is approximately 39 times higher than it was in 2021.
High LTV does not determine whether a loan will perform. It does reduce the borrower’s initial equity cushion. When high leverage is combined with a higher DTI and the possibility of a future rate adjustment, the loan deserves closer monitoring.
The data points to three connected forces.
Elevated rates and home prices have increased the monthly cost of purchasing a home. A lower initial ARM rate can improve qualification or reduce the early payment burden.
For some borrowers, the decision may rest on an expectation that they will refinance, sell the property or increase their income before the first adjustment. Each of those outcomes carries uncertainty.
Independent mortgage banks have taken the leading positions in agency ARM production.
Their presence across multiple origination channels can help them introduce ARM products quickly, reach a broad set of loan officers and brokers, and respond to changes in borrower demand.
The movement in FICO, LTV and DTI shows that agency ARM usage has expanded into a more leveraged segment of the market.
ARMs appear to be serving more borrowers for whom the initial payment carries considerable weight in the mortgage decision.
Today’s agency ARM market should not be equated with the full range of nontraditional mortgage products offered before the financial crisis.
The loans covered in this analysis entered agency or government mortgage-backed securities. They are distinct from the private-label option ARMs, negative-amortization products and loosely underwritten loans frequently associated with the pre-crisis market.
Product structure still matters.
ARM borrowers and loan officers should understand:
The current credit profile adds another layer to that evaluation. Compared with 2021, today’s agency ARM borrowers have higher leverage, greater debt burdens and less equity protection.
Lenders should examine ARM production by FICO, LTV, DTI, geography, loan purpose, loan type, occupancy and channel.
Averages provide a directional view. The concentration of loans across several risk characteristics can reveal more than any single measure.
Borrowers need a clear explanation of how the loan can change after the introductory period. The discussion should cover the initial rate, adjustment schedule, index, margin, caps and possible future payment. A borrower choosing an ARM to solve an immediate affordability problem also needs to understand the longer-term obligation.
Banks and credit unions should evaluate why IMBs now dominate the top agency ARM rankings. Useful questions include:
The charts in this analysis describe origination characteristics. They do not measure delinquency, default, prepayment or long-term borrower outcomes. The shift toward lower FICO, higher LTV and higher DTI is an early credit-profile signal. Performance analysis will show whether that movement translates into different outcomes over time.
The agency ARM market has entered a different phase.
ARM share has increased tenfold since 2021. IMBs now hold every position among the 10 largest agency ARM seller/issuers. The average borrower has a lower credit score, higher leverage and a higher debt-to-income ratio.
These findings do not establish that an ARM is unsuitable for a particular borrower. They show that ARMs are increasingly being used in circumstances where affordability, qualification and financial flexibility carry more weight.
For lenders, that creates a product opportunity. It also increases the importance of underwriting, borrower education, product design and performance monitoring.
The agency ARM comeback deserves attention because of who is leading it and who is borrowing.
Explore agency ARM production by lender, geography, loan purpose, channel and borrower profile in MBS Pivot, Polygon Research’s loan-level agency mortgage intelligence platform.
Yes. Agency ARM market share increased from 0.31% in 2021 to 3.34% YTD 2026. That represents an increase of ten times, although ARMs still account for a minority of total agency mortgage originations.
PennyMac Loan Services ranked first among agency ARM seller/issuers in YTD 2026, with 4,675 loans during the period analyzed.
Today’s agency ARM market differs from the private-label option ARMs and other exotic mortgage products associated with the pre-crisis period. The loans analyzed here entered Fannie Mae, Freddie Mac or Ginnie Mae securities. Borrower leverage, DTI, product terms and future payment exposure still require careful evaluation.
MBS Pivot allows mortgage professionals to examine agency ARM activity by seller/issuer, geography, agency, channel, loan purpose, FICO, LTV, DTI and other loan characteristics.