Credit Union Secondary Market Strategy: Hold or Sell?

Key takeaways
- Credit unions sold just 6% of their 2025 mortgage originations to agencies. They reported more than a million originations; 62,040 were sold to Fannie Mae, Freddie Mac or Ginnie Mae.
- The median credit union GSE seller sold 28 loans all year. In 2025, 13 institutions accounted for 40.6% of identified credit union sales to Fannie Mae and Freddie Mac.
- Credit unions sold smaller loans with stronger average credit profiles. Their 2025 GSE loans averaged about $60,000 less than the all-seller average.
- A loan sale can preserve the servicing relationship. With servicing retained, members keep making payments to their credit union while the sale releases funds for further lending.
- Could your credit union double agency sales within 90 days? Use 2027 planning to decide what would change your hold-or-sell mix and test whether pricing, hedging, quality control and delivery could support it.
For a credit union planning its mortgage business, the decision to hold or sell a loan shapes funding needs, earnings and capacity for the next member. A useful secondary market strategy makes that choice explicit and revisits it as the institution’s balance sheet and member needs change.
I spent more than a decade inside depository institutions, supporting home-lending teams with strategy, market analysis and business planning. Today, at Polygon Research, I examine the same decisions through loan-level mortgage data. The numbers describe what institutions did. Understanding why requires looking at their policies and operating choices.
The question I raised in ACUMA Pipeline remains useful for 2027 planning: are you an occasional seller by design?
How much do credit unions sell to the agencies?
In the 2025 HMDA analysis behind the article, credit unions reported 1,003,519 mortgage originations. Of those, 62,040 were reported as sold to Fannie Mae, Freddie Mac or Ginnie Mae, just over 6%.
The share varied with institution size. Credit unions with $50 billion to $100 billion in assets reported agency sales equal to roughly 14% of originations. The share was about 6% for institutions with $2 billion to $10 billion in assets and about 1% for those below $250 million.
This is a starting point for a peer comparison. The denominator is the full origination population used in the analysis. It does not establish how many loans were eligible for agency delivery, and the remaining 94% includes loans retained in portfolio as well as loans sold through other routes.
A more useful institution-level comparison would narrow the population by product, lien position and other relevant characteristics, then examine the credit union’s own retained and sold loans. Size alone cannot explain the choice.
What does an occasional GSE seller look like?
Loan-level mortgage-backed securities disclosures provide another view. Polygon Research identified 421 credit unions appearing as sellers under their own names in Fannie Mae and Freddie Mac records for 2025. Together, they accounted for 56,659 loans.
Of those institutions, 259 sold fewer than 50 loans during the year. Seventy-two sold fewer than 10. The median seller sold 28 loans. At the other end, 13 credit unions sold at least 1,000 loans each and accounted for 40.6% of identified credit union GSE volume.
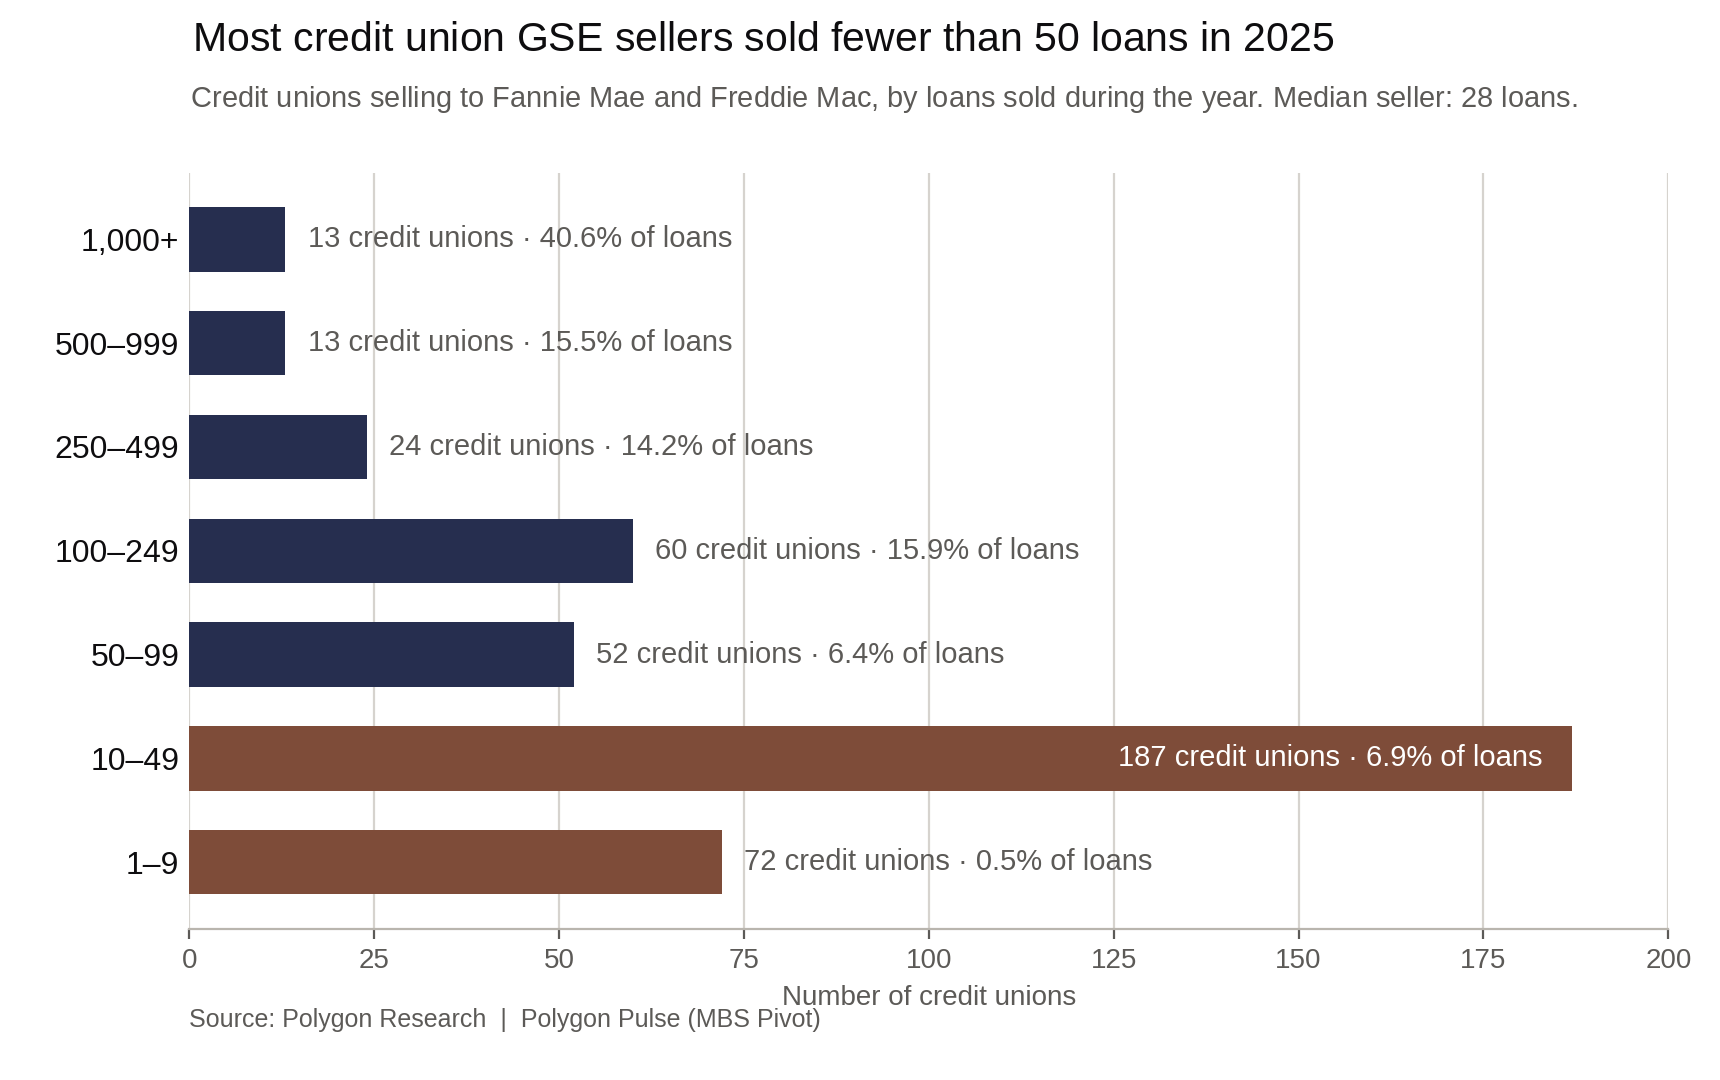
An institution selling 28 loans may have chosen that volume carefully. It may retain most eligible production, use a correspondent or participate in a Federal Home Loan Bank mortgage program. Indirect sales can appear under another seller’s name in agency records.
The operational question is how that route fits the credit union’s plan. Is selling a routine option with known economics and available staff? How much additional volume could it carry if the institution’s funding position changed?
What can the loans sold tell us?
The credit union loans that reached Fannie Mae and Freddie Mac had an average balance of $287,075, about $60,000 below the all-seller average. Their average note rate was 6.42%, compared with 6.50% for all sellers. They also had higher average credit scores and lower debt-to-income and loan-to-value ratios.
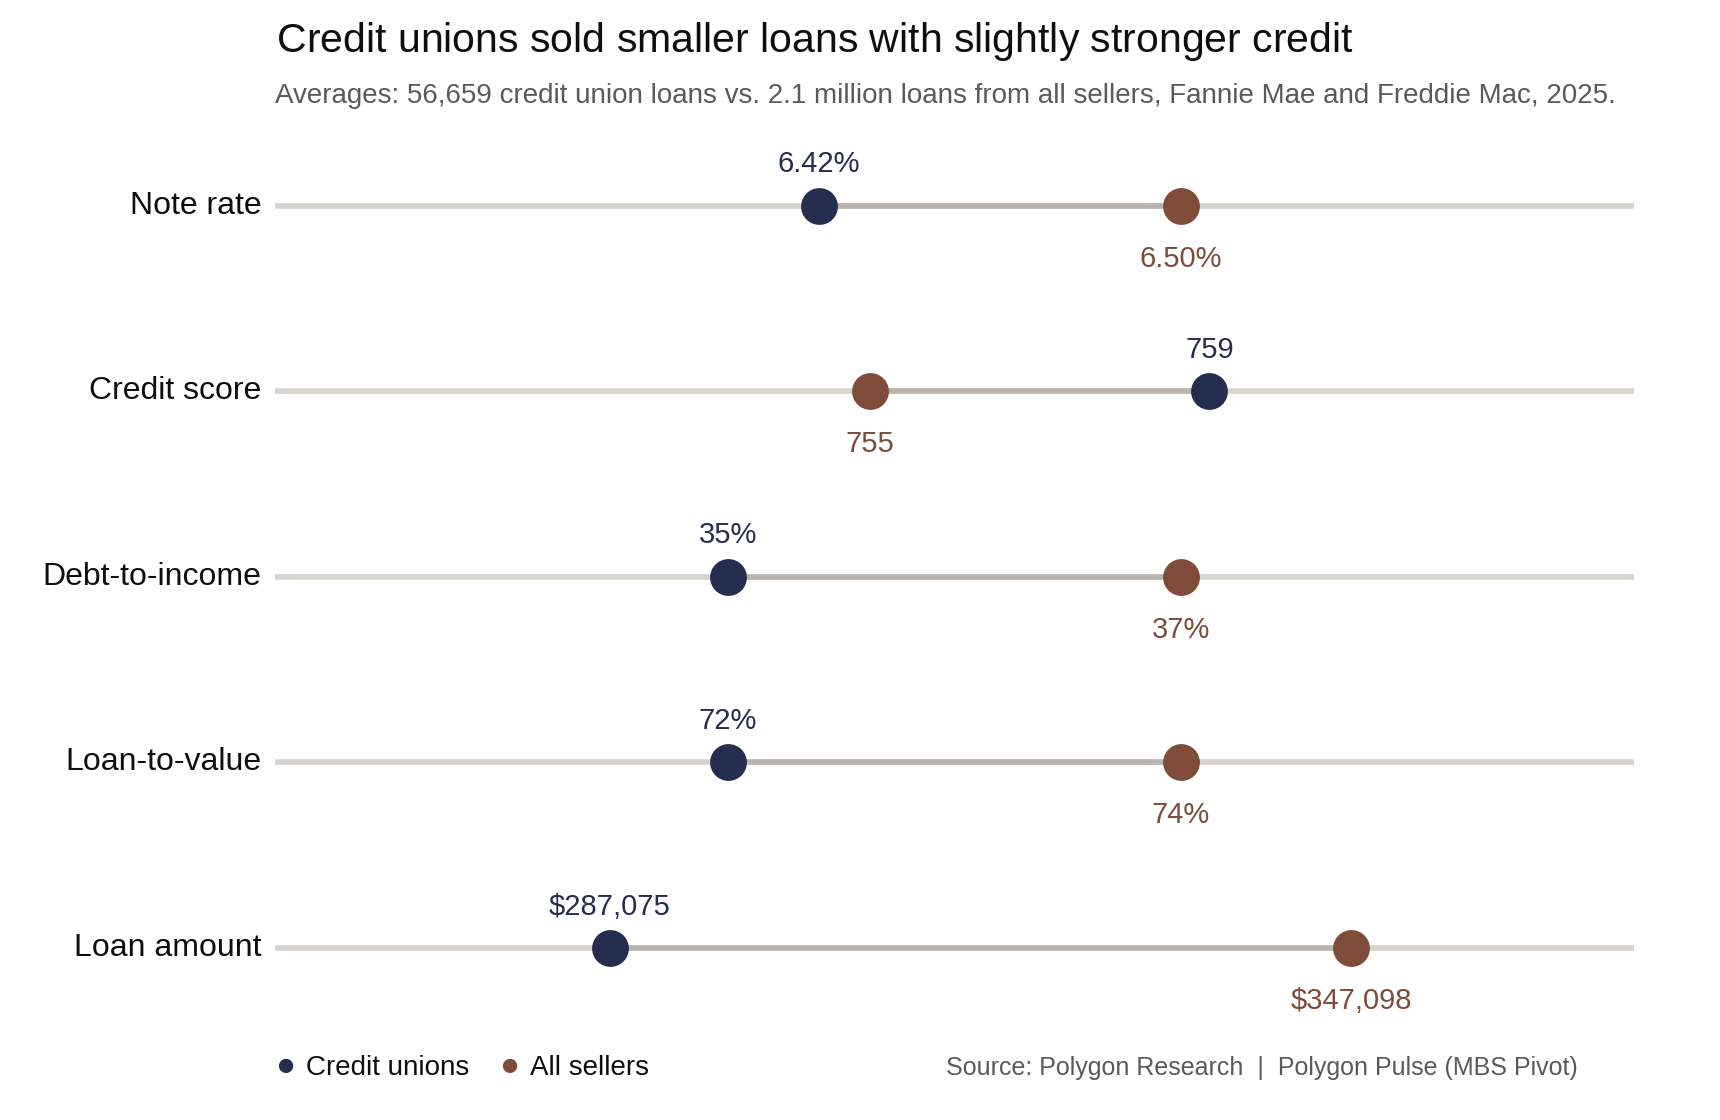
Those differences describe the loans sold. They do not establish the eligibility of the loans retained or isolate a pricing advantage. Borrower characteristics, loan products and timing all affect averages. For a useful pricing comparison, a credit union would examine similar loans on a consistent basis.
The comparison does provide a reason to look more closely at product and member mix. Which loans are being sold today? Which borrowers do they serve? Where might the credit union’s retained production differ?
How should leadership approach the hold-or-sell decision?
Portfolio lending can preserve spread and fit an institution’s funding, capital and interest-rate position. Loan sales can release funds for further lending. Servicing arrangements also matter: a credit union that sells a loan while retaining servicing can continue handling the member’s payments and servicing relationship.
The balance belongs in a policy that identifies the loans the institution expects to hold, those it expects to sell and the conditions that would change the decision. A change in deposit costs, liquidity or concentration may alter the preferred mix.
Execution capacity needs attention before that change arrives. Leadership should understand the economics and capacity of each available route, whether through its own GSE seller approval, a correspondent, an FHLB mortgage program or another investor. A low annual sales count leaves those questions open.
Five questions for the next ALCO meeting
The asset-liability committee can use the questions below to connect the market evidence with its own records. The second column turns each question into a specific request for information.
Review the past 12 months of originations for agency eligibility, then identify what was retained, sold directly or placed through other channels.
Bring the policy, product and concentration limits, and the funding or liquidity conditions that would change the decision. Name the owner of that decision.
Compare funding costs, expected spread, servicing value, capital usage, credit exposure and execution costs on a consistent basis.
Compare institutions with similar asset size, product mix and markets. Separate direct GSE deliveries from broader secondary-market activity.
Test whether pricing, hedging, quality control and delivery operations could support twice the current volume within 90 days, including the people and counterparties required.
For 2027 planning, the useful outcome is an agreed hold-or-sell policy, an understanding of the alternatives and a realistic view of operating capacity. The institution should be able to explain its current mix and the conditions under which it would choose a different one.
Explore your credit union’s position
Polygon Research’s HMDAVision supports origination and peer analysis. MBS Pivot provides the agency loan and seller detail behind the GSE comparisons in this article. Our credit union resources connect that evidence with local mortgage markets and member opportunity.
ACUMA attendees planning for 2027 can book a Complimentary Secondary-Market Opportunity Review with Val Buresch, CMB, MBA, to explore their institution’s mortgage footprint, relevant peer comparisons and opportunities for growth.
Sources and methodology
Figures come from Polygon Research’s Credit unions and the GSEs research deck and the original ACUMA Pipeline article. The visuals above use full-year 2025 data. HMDAVision supplies the HMDA origination and purchaser analysis; MBS Pivot supplies loan-level Fannie Mae and Freddie Mac seller and loan comparisons.
The 62,040 HMDA agency-sales figure and the 56,659 GSE-delivery figure describe different populations and reporting frameworks. The HMDA measure includes Fannie Mae, Freddie Mac and Ginnie Mae purchaser categories. The MBS comparisons here cover Fannie Mae and Freddie Mac only and identify credit unions under their own seller names. Differences in coverage, reporting timing and seller attribution mean the two totals should not be treated as a direct reconciliation.
Seller counts do not capture every indirect channel through which a credit union’s loans may reach the GSEs. The six-percent share is a count-based measure of reported originations, rather than a measure of balance-sheet assets or the share of eligible loans sold. Loan-characteristic comparisons are unadjusted averages. Figures and rounded shares retain the definitions used in the original research.

