Articles
6 min

What Is the CPS ASEC? How Housing and Mortgage Analysts Use It

October 14, 2026
Updated on:
October 15, 2026
ASEC 2026 thumbnail
Author:
Val Buresch, CMB

Key takeaways

  • The CPS ASEC is the federal survey behind the official U.S. income and poverty statistics. The Census Bureau released the 2026 edition on September 15, 2026. Its income measures cover calendar year 2025.
  • Median household income reached $87,460 in 2025, up 2.6% from 2024. The official poverty rate fell 0.5 percentage points to 10.2%, according to the Census Bureau.
  • The 2026 ASEC is now in CPS Pivot. The October refresh also adds September 2026 monthly CPS, September 2026 agency MBS originations in MBS Pivot and August 2026 FHA data in FHA Pivot.
  • Household data shows demand before it becomes a loan application. Use it to study who is moving into a market, what renters earn and which generations are forming households.
  • Start with a question in mortgagedata.ai. Then explore the evidence in the dashboards and carry it into a market plan or policy brief.

Every mortgage starts as a household decision. A family relocates for a job, a renter decides this is the year to buy, a young worker moves out on their own. Lending data shows the households that applied. Household data shows the much larger group that could, and how its income, work and living situation are changing.

That is why the annual release of the Current Population Survey Annual Social and Economic Supplement, the CPS ASEC, matters to anyone planning mortgage strategy or housing policy. It refreshes the evidence on the people behind housing demand. This guide explains what the ASEC measures, what the 2026 release shows, and how to use it alongside lending and loan performance data.

What is the CPS ASEC?

The CPS ASEC is an annual supplement to the Current Population Survey, the monthly household survey run by the U.S. Census Bureau and the Bureau of Labor Statistics. Census conducts the supplement each February, March and April. It asks households detailed questions about the previous calendar year: income from every source, work experience, poverty status, health insurance, noncash benefits and whether the household moved in the past year.

The ASEC is the source of the official U.S. measures of household income and poverty. Census publishes the headline findings each September, and the public-use microdata follows. Because the file is household-level microdata, analysts can cut it by age, tenure, occupation, education, region and metropolitan area rather than relying on published tables alone.

What the 2026 ASEC shows

The Census Bureau's September 15, 2026 release reported three national headlines for 2025:

  • Median household income was $87,460, up 2.6% from $85,210 in 2024.
  • The official poverty rate was 10.2%, down 0.5 percentage points.
  • The Supplemental Poverty Measure was 13.1%, not statistically different from 2024.

For housing and mortgage work, the national median is a starting point. The decisions sit in the distribution underneath it: how renter incomes compare with owner incomes, how younger households are doing, and which metros are gaining working-age movers. That is the analysis CPS Pivot is built for.
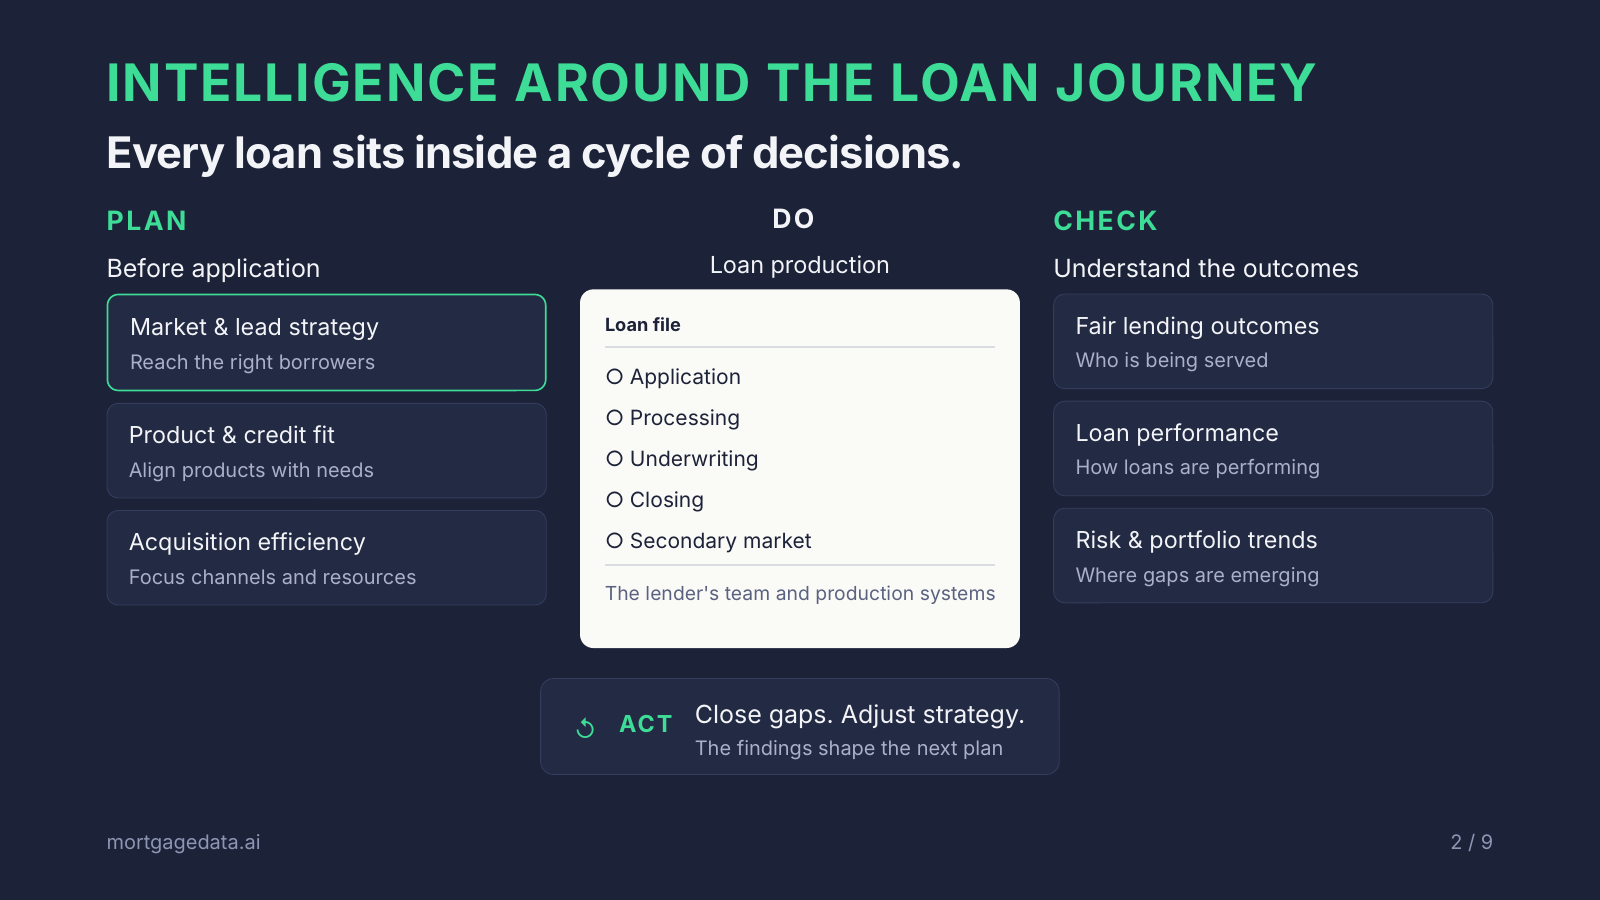
Diagram of mortgage decisions around the loan: market and product planning before application, loan production, outcome review after closing, and findings that shape the next plan

Why household data matters for mortgage decisions

Lenders make some of their most consequential decisions before a loan exists. Which markets to grow in, which products to offer, which loan officers to recruit and where to spend marketing dollars all depend on who lives in a market and who is about to need financing.

After production, the questions turn to outcomes: who was served, how those loans perform, and what to change. The answers feed the next plan. Household data, lending data and loan performance data each cover a different part of that cycle. Used together, they let a team follow one business question from the first plan to the next.

A practical example is the question many lenders are asking for 2027: where should we grow our purchase business? The household evidence in the ASEC shapes the first answer.

What's in the October refresh

The October 2026 refresh updates all three Polygon Pulse dashboards. Each source keeps its own reporting period.

DataPeriodWhat you can examineDashboard
CPS ASEC 2026Income for calendar year 2025Household income, poverty, relocation, housing tenureCPS Pivot
Monthly CPSSeptember 2026Employment, occupation, education, generationsCPS Pivot
Agency MBSOriginations through September 2026Loan-level originations, credit box, pricing, VantageScore 4.0, sellersMBS Pivot
FHAAugust 2026First-time buyers, down payment assistance, brokers and wholesalersFHA Pivot

MBS Pivot dates loans by origination month, so the most recent one to two months fill in as those loans reach agency securities. FHA and ASEC figures describe their own periods, so compare them with that in mind.

What you can do with ASEC data: five questions

1. Who is moving into your market, and what do they earn?

The ASEC asks whether each household moved in the past year and where it came from. Combined with income and age, that shows whether a metro is attracting working-age households with the earnings to support a purchase, or losing them. For a lender choosing where to grow, that is an early signal of purchase demand.

Atlanta Metro Relocation Trends

2. How many renters are getting close to owning?

Housing tenure and household income together show how many renter households sit in income ranges that typically support a first purchase in a given market. Lenders use this to size first-time buyer programs. Policy analysts use it to frame access-to-homeownership questions with current figures.

3. Which generations and occupations are forming households?

Monthly CPS adds employment, occupation, education and age. That lets a team test its audience assumptions, for example how Gen Z workers in a metro compare with millennials on income and tenure, before choosing a marketing approach or a loan officer profile.

4. How do household incomes line up with lending activity?

Household data becomes more useful next to the loans. HMDA shows who is originating in a market and to whom. FHA Pivot shows first-time buyer activity and down payment assistance. MBS Pivot shows the agency credit box and pricing. Together they show whether the households in a market are being served, and by whom.

FHA Pivot and MBS Pivot views of first-time buyer activity and the agency credit box in the same market.

‍

5. What has changed since last year's policy brief?

For housing policy analysts, the ASEC is the annual benchmark for income and poverty. Updating a brief means comparing 2025 income and poverty by tenure, age and region with the prior year, and checking which conclusions still hold. CPS Pivot keeps definitions consistent across years, so year-over-year comparisons reflect real change in the data.

How to use it: from question to plan

  1. Ask. Type the question in plain language in mortgagedata.ai, for example "How have renter household incomes changed in the Atlanta metro?" Every answer shows where it came from.
  2. Explore. Open CPS Pivot, FHA Pivot or MBS Pivot to drill into the evidence by geography, age, income, lender or loan type.
  3. Decide. Carry the findings into the market plan, the board deck or the policy brief.
  4. Come back. Return as the data refreshes each month. The definitions stay the same, so you can see what changed.
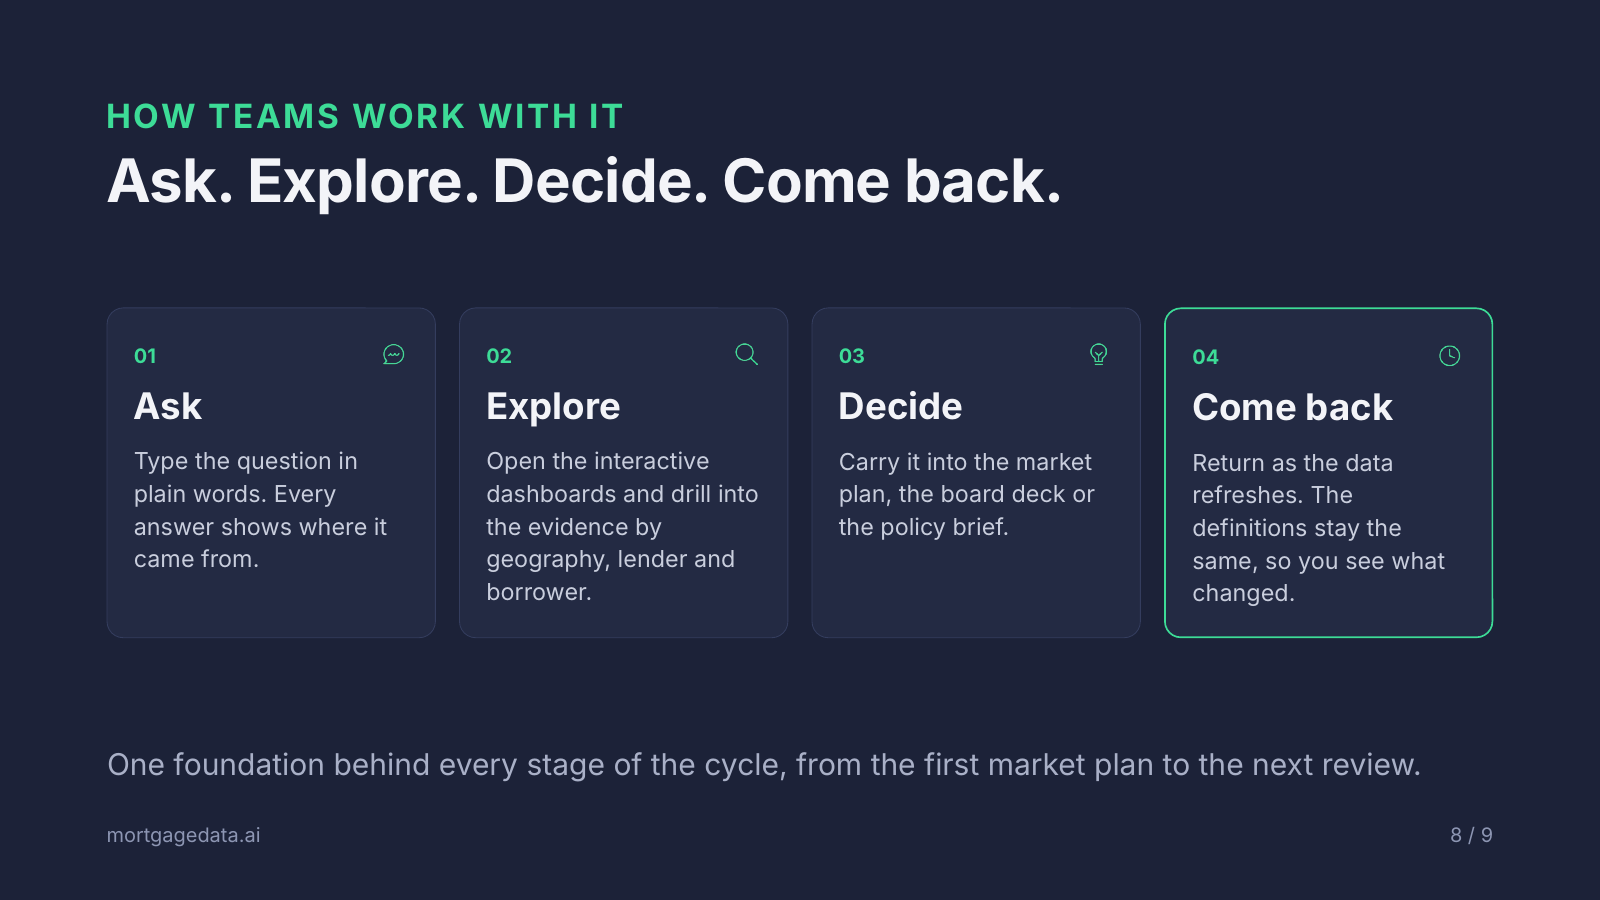
Four steps for working with mortgage market intelligence: ask in mortgagedata.ai, explore the dashboards, decide in a plan or brief, and come back as data refreshes
Four steps for working with mortgage market intelligence

Who uses ASEC data

  • Housing policy analysts and researchers use it to measure income, poverty and housing tenure, and to update briefs on affordability and access to homeownership.
  • Mortgage lenders and credit unions use it to size purchase demand, plan first-time buyer programs and choose growth markets.
  • CRA and community development teams use it to understand the households in their assessment areas alongside lending outcomes.
  • Marketing and recruiting leaders use it to understand the age, occupation and income of the borrowers they want to reach.

Limits to keep in mind

  • Geography. The ASEC sample supports national, state and larger metro estimates. For counties and tracts, pair it with the American Community Survey, which has a much larger sample.
  • Reference period. ASEC income describes the prior calendar year. The 2026 ASEC covers 2025 income.
  • Survey estimates. ASEC figures carry margins of error. Small differences between groups or years may not be statistically meaningful.
  • Household level. Results describe groups of households in a geography. They never identify an individual.

Explore the data

Ask your first question in mortgagedata.ai, then explore the household evidence in CPS Pivot, FHA activity in FHA Pivot and agency originations in MBS Pivot. For lending outcomes by geography, see HMDAVision. Data and feature access vary by plan. Talk with us about access.

Sources and methodology

National income and poverty figures come from the U.S. Census Bureau, Income, Poverty and Health Insurance Coverage in the United States: 2025, released September 15, 2026. CPS Pivot uses CPS ASEC and monthly CPS public-use microdata. MBS Pivot uses loan-level agency MBS data dated by origination month. FHA Pivot uses FHA single-family data through August 2026. Each source has its own reporting period, noted in the table above.

Articles
Val Buresch, CMB
6 min

What Is the CPS ASEC? How Housing and Mortgage Analysts Use It

Published
October 14, 2026
Updated
October 15, 2026

What the CPS ASEC measures, what the 2026 release shows, and how lenders and policy analysts use household data to plan growth and housing policy.

ASEC 2026 thumbnail

Key takeaways

  • The CPS ASEC is the federal survey behind the official U.S. income and poverty statistics. The Census Bureau released the 2026 edition on September 15, 2026. Its income measures cover calendar year 2025.
  • Median household income reached $87,460 in 2025, up 2.6% from 2024. The official poverty rate fell 0.5 percentage points to 10.2%, according to the Census Bureau.
  • The 2026 ASEC is now in CPS Pivot. The October refresh also adds September 2026 monthly CPS, September 2026 agency MBS originations in MBS Pivot and August 2026 FHA data in FHA Pivot.
  • Household data shows demand before it becomes a loan application. Use it to study who is moving into a market, what renters earn and which generations are forming households.
  • Start with a question in mortgagedata.ai. Then explore the evidence in the dashboards and carry it into a market plan or policy brief.

Every mortgage starts as a household decision. A family relocates for a job, a renter decides this is the year to buy, a young worker moves out on their own. Lending data shows the households that applied. Household data shows the much larger group that could, and how its income, work and living situation are changing.

That is why the annual release of the Current Population Survey Annual Social and Economic Supplement, the CPS ASEC, matters to anyone planning mortgage strategy or housing policy. It refreshes the evidence on the people behind housing demand. This guide explains what the ASEC measures, what the 2026 release shows, and how to use it alongside lending and loan performance data.

What is the CPS ASEC?

The CPS ASEC is an annual supplement to the Current Population Survey, the monthly household survey run by the U.S. Census Bureau and the Bureau of Labor Statistics. Census conducts the supplement each February, March and April. It asks households detailed questions about the previous calendar year: income from every source, work experience, poverty status, health insurance, noncash benefits and whether the household moved in the past year.

The ASEC is the source of the official U.S. measures of household income and poverty. Census publishes the headline findings each September, and the public-use microdata follows. Because the file is household-level microdata, analysts can cut it by age, tenure, occupation, education, region and metropolitan area rather than relying on published tables alone.

What the 2026 ASEC shows

The Census Bureau's September 15, 2026 release reported three national headlines for 2025:

  • Median household income was $87,460, up 2.6% from $85,210 in 2024.
  • The official poverty rate was 10.2%, down 0.5 percentage points.
  • The Supplemental Poverty Measure was 13.1%, not statistically different from 2024.

For housing and mortgage work, the national median is a starting point. The decisions sit in the distribution underneath it: how renter incomes compare with owner incomes, how younger households are doing, and which metros are gaining working-age movers. That is the analysis CPS Pivot is built for.

Diagram of mortgage decisions around the loan: market and product planning before application, loan production, outcome review after closing, and findings that shape the next plan

Why household data matters for mortgage decisions

Lenders make some of their most consequential decisions before a loan exists. Which markets to grow in, which products to offer, which loan officers to recruit and where to spend marketing dollars all depend on who lives in a market and who is about to need financing.

After production, the questions turn to outcomes: who was served, how those loans perform, and what to change. The answers feed the next plan. Household data, lending data and loan performance data each cover a different part of that cycle. Used together, they let a team follow one business question from the first plan to the next.

A practical example is the question many lenders are asking for 2027: where should we grow our purchase business? The household evidence in the ASEC shapes the first answer.

What's in the October refresh

The October 2026 refresh updates all three Polygon Pulse dashboards. Each source keeps its own reporting period.

DataPeriodWhat you can examineDashboard
CPS ASEC 2026Income for calendar year 2025Household income, poverty, relocation, housing tenureCPS Pivot
Monthly CPSSeptember 2026Employment, occupation, education, generationsCPS Pivot
Agency MBSOriginations through September 2026Loan-level originations, credit box, pricing, VantageScore 4.0, sellersMBS Pivot
FHAAugust 2026First-time buyers, down payment assistance, brokers and wholesalersFHA Pivot

MBS Pivot dates loans by origination month, so the most recent one to two months fill in as those loans reach agency securities. FHA and ASEC figures describe their own periods, so compare them with that in mind.

What you can do with ASEC data: five questions

1. Who is moving into your market, and what do they earn?

The ASEC asks whether each household moved in the past year and where it came from. Combined with income and age, that shows whether a metro is attracting working-age households with the earnings to support a purchase, or losing them. For a lender choosing where to grow, that is an early signal of purchase demand.

Atlanta Metro Relocation Trends

2. How many renters are getting close to owning?

Housing tenure and household income together show how many renter households sit in income ranges that typically support a first purchase in a given market. Lenders use this to size first-time buyer programs. Policy analysts use it to frame access-to-homeownership questions with current figures.

3. Which generations and occupations are forming households?

Monthly CPS adds employment, occupation, education and age. That lets a team test its audience assumptions, for example how Gen Z workers in a metro compare with millennials on income and tenure, before choosing a marketing approach or a loan officer profile.

4. How do household incomes line up with lending activity?

Household data becomes more useful next to the loans. HMDA shows who is originating in a market and to whom. FHA Pivot shows first-time buyer activity and down payment assistance. MBS Pivot shows the agency credit box and pricing. Together they show whether the households in a market are being served, and by whom.

FHA Pivot and MBS Pivot views of first-time buyer activity and the agency credit box in the same market.

‍

5. What has changed since last year's policy brief?

For housing policy analysts, the ASEC is the annual benchmark for income and poverty. Updating a brief means comparing 2025 income and poverty by tenure, age and region with the prior year, and checking which conclusions still hold. CPS Pivot keeps definitions consistent across years, so year-over-year comparisons reflect real change in the data.

How to use it: from question to plan

  1. Ask. Type the question in plain language in mortgagedata.ai, for example "How have renter household incomes changed in the Atlanta metro?" Every answer shows where it came from.
  2. Explore. Open CPS Pivot, FHA Pivot or MBS Pivot to drill into the evidence by geography, age, income, lender or loan type.
  3. Decide. Carry the findings into the market plan, the board deck or the policy brief.
  4. Come back. Return as the data refreshes each month. The definitions stay the same, so you can see what changed.
Four steps for working with mortgage market intelligence: ask in mortgagedata.ai, explore the dashboards, decide in a plan or brief, and come back as data refreshes
Four steps for working with mortgage market intelligence

Who uses ASEC data

  • Housing policy analysts and researchers use it to measure income, poverty and housing tenure, and to update briefs on affordability and access to homeownership.
  • Mortgage lenders and credit unions use it to size purchase demand, plan first-time buyer programs and choose growth markets.
  • CRA and community development teams use it to understand the households in their assessment areas alongside lending outcomes.
  • Marketing and recruiting leaders use it to understand the age, occupation and income of the borrowers they want to reach.

Limits to keep in mind

  • Geography. The ASEC sample supports national, state and larger metro estimates. For counties and tracts, pair it with the American Community Survey, which has a much larger sample.
  • Reference period. ASEC income describes the prior calendar year. The 2026 ASEC covers 2025 income.
  • Survey estimates. ASEC figures carry margins of error. Small differences between groups or years may not be statistically meaningful.
  • Household level. Results describe groups of households in a geography. They never identify an individual.

Explore the data

Ask your first question in mortgagedata.ai, then explore the household evidence in CPS Pivot, FHA activity in FHA Pivot and agency originations in MBS Pivot. For lending outcomes by geography, see HMDAVision. Data and feature access vary by plan. Talk with us about access.

Sources and methodology

National income and poverty figures come from the U.S. Census Bureau, Income, Poverty and Health Insurance Coverage in the United States: 2025, released September 15, 2026. CPS Pivot uses CPS ASEC and monthly CPS public-use microdata. MBS Pivot uses loan-level agency MBS data dated by origination month. FHA Pivot uses FHA single-family data through August 2026. Each source has its own reporting period, noted in the table above.

Frequently Asked Questions

What is the CPS ASEC?

The CPS ASEC, or Current Population Survey Annual Social and Economic Supplement, is an annual household survey run by the U.S. Census Bureau and the Bureau of Labor Statistics. It is the source of the official U.S. income and poverty statistics and covers income, work, poverty, health insurance and relocation for the prior calendar year.

Icon - Elements Webflow Library - BRIX Templates

When is ASEC data released, and what year does it cover?

Census conducts the ASEC each February through April and publishes the headline findings each September. The 2026 ASEC was released on September 15, 2026 and describes income and poverty in calendar year 2025.

Icon - Elements Webflow Library - BRIX Templates

What is the difference between the CPS ASEC and the American Community Survey?

The ASEC is the official source for national income and poverty and asks detailed income questions, but its sample supports national, state and larger metro estimates. The American Community Survey has a much larger sample and covers counties and tracts. Housing analysts often use the ASEC for income detail and the ACS for small geographies.

Icon - Elements Webflow Library - BRIX Templates

How can mortgage lenders use ASEC data?

Lenders use ASEC data to size purchase demand before choosing growth markets: who is moving into a metro, what renters earn, and which generations and occupations are forming households. Paired with HMDA, FHA and agency MBS data, it shows whether those households are being served and by whom.

Icon - Elements Webflow Library - BRIX Templates

Explore Mortgage Market Intelligence in Practice

See how Polygon helps teams grow through insight.