Agency ARM Share vs Fixed-to-ARM Spread
Loan Pricing
Origination Trends
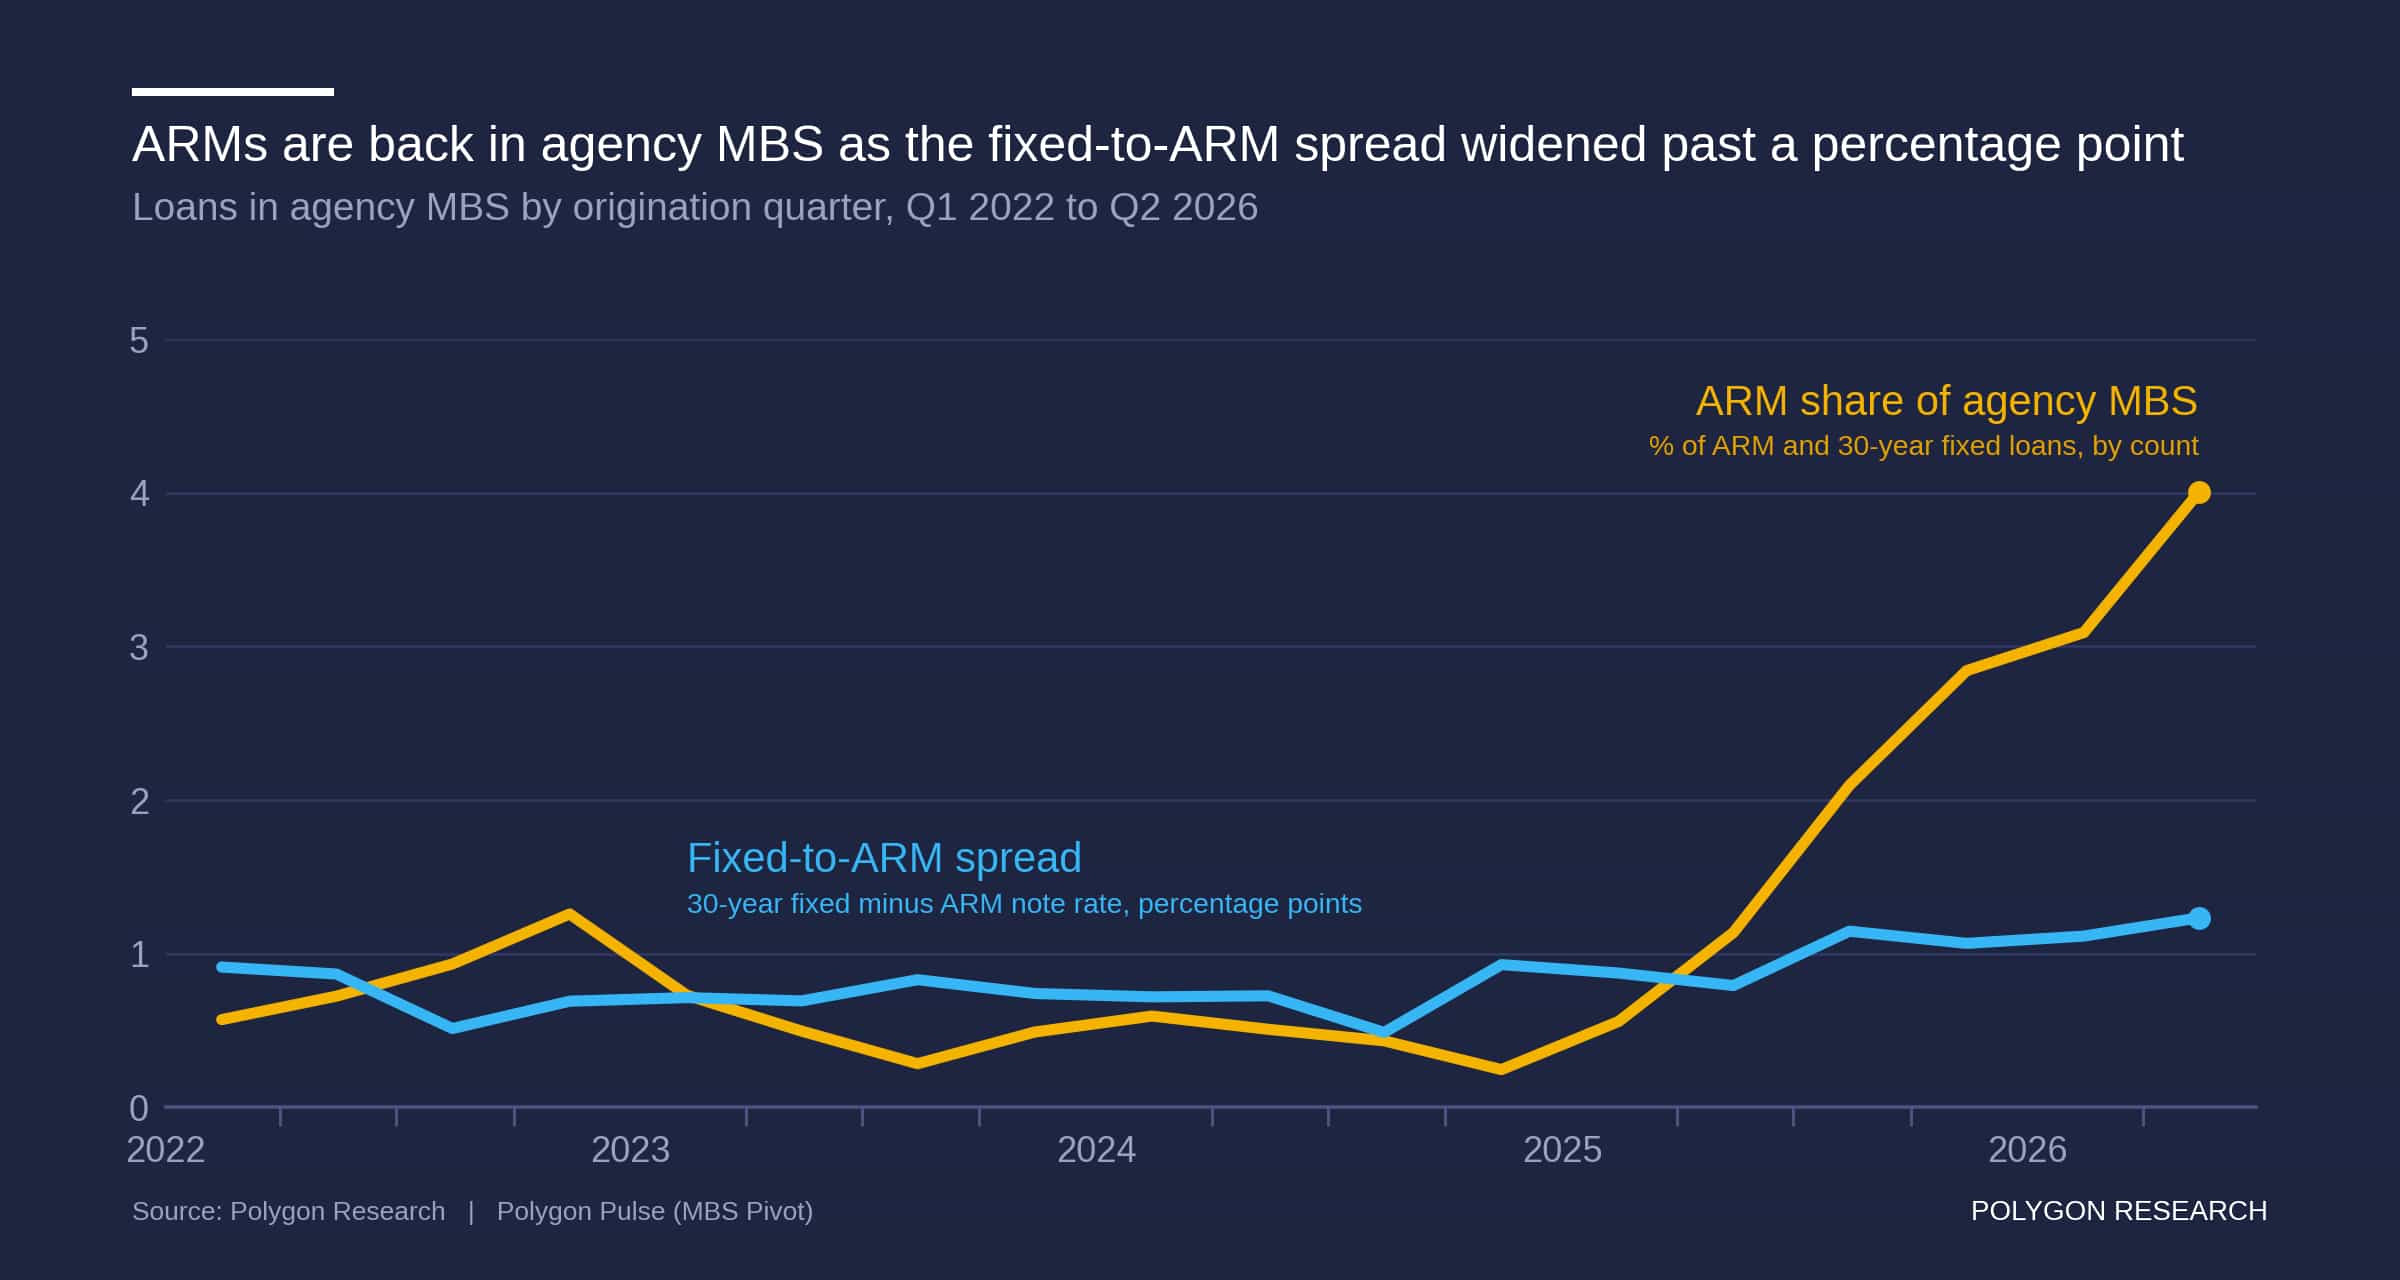
Line chart, Q1 2022 to Q2 2026, quarterly. A gold line shows ARM share of agency MBS loans holding under 1% through 2024, then rising to 4.0% in Q2 2026. A blue line shows the fixed-to-ARM note-rate spread, 30-year fixed minus ARM, holding near 0.7 percentage points through 2024, then widening to 1.23 by Q2 2026. Source: Polygon Research, Polygon Pulse (MBS Pivot).
Chart Download and Page Share

Share or Download

Data Points
Chart | ARM share of agency MBS vs the fixed-to-ARM spread | quarterly | Q1 2022 to Q2 2026 Scope | ARM and 30-year fixed-rate loans in agency MBS, by origination quarter | all loan types and purposes | Q3 2026 excluded as incomplete ARM share | ARM loans as a percent of ARM plus 30-year fixed loans, by count Fixed-to-ARM spread | average note rate on 30-year fixed minus average note rate on ARMs | count-weighted | percentage points | realized spread, after mix and permanent buydowns ARM share | 2023 to 2024 range 0.2% to 0.7% | low Q4 2024 0.24% | Q2 2026 4.0% Fixed-to-ARM spread | 2022 to 2024 average about 0.7 | above 1.0 in every quarter since Q3 2025 | Q2 2026 1.23 Q2 2026 average note rates | ARM 4.92% | 30-year fixed 6.16% Average agency ARM loan amount, 2026 YTD | about $424,000 Full quarterly series, and cuts by seller/issuer, loan type, purpose, credit score, LTV and state | Polygon Pulse, MBS Pivot
Why are adjustable-rate mortgages back in agency MBS?
ARMs were 4.0% of agency ARM and 30-year fixed loans in Q2 2026, up from 0.24% in Q4 2024, as the fixed-to-ARM note-rate spread widened from about 0.7 to 1.23 percentage points.
Date Published:
September 11, 2026
Date Updated:
September 11, 2026
Chart type:
Line Chart
Suggested Citation:
Polygon Research, "ARM Share of Agency MBS vs the Fixed-to-ARM Spread, Q1 2022 to Q2 2026," Polygon Pulse – MBS Pivot, published September 11, 2026. Scope: ARM and 30-year fixed-rate loans in agency MBS by origination quarter. Metrics: ARM share of ARM plus 30-year fixed loan count; average note rate on 30-year fixed minus average note rate on ARMs, count-weighted, in percentage points. Data through June 2026; Q3 2026 excluded as incomplete. Accessed September 11, 2026.
Key insights

ARMs were 4.0% of agency ARM and 30-year fixed loans originated in Q2 2026, up from 0.24% in Q4 2024. The fixed-to-ARM spread widened over the same period, from a 2022 to 2024 range of 0.5 to 0.9 percentage points to 1.23. Q2 2026 produced 35,837 agency ARMs, 8.5 times the Q2 2024 count.

The spread is the average note rate on 30-year fixed loans minus the average on ARMs, both from loans in agency MBS in the same origination quarter, count-weighted. It is a realized spread, after mix and any permanent buydowns, so it runs wider than the rate-sheet spread in MBA’s weekly survey. The MBA survey puts the ARM share of applications near 8% with an average ARM balance above $900,000, a jumbo, portfolio market. This chart counts conforming-balance loans; the average agency ARM is $424,000. See the same spread for first-time buyers and ARM note rates by loan type.

The comparison works at the lender level. MBS Pivot carries both series for every seller/issuer, so a lender can plot its own ARM share and spread by quarter against the agency market, against a peer set such as the top 10 agency ARM seller/issuers, banks versus independent mortgage bankers or builder-affiliated lenders. Share that lags the market at the same spread points to product and channel. A spread narrower than the market’s points to pricing. Explore ARM originations in MBS Pivot.

From Analysis to Action

This analysis provides a clear blueprint for how to uncover meaningful market dynamics. Its true power is unleashed when you apply this same methodology to your own local markets. Because all real estate is local, this granular approach is essential for crafting precise strategies that effectively address the unique conditions of each community.

Ready to Continue? Get Your Exact Market Answers.

Go beyond generic insights. Polygon's interactive tools and limitless filtering empower you to tailor market data to your specific strategy.
Start your 7-day free trial.
Unlock My Custom Insights Now - Free Trial