FHA Adjustable-Rate Refinance Trends
Government Loans
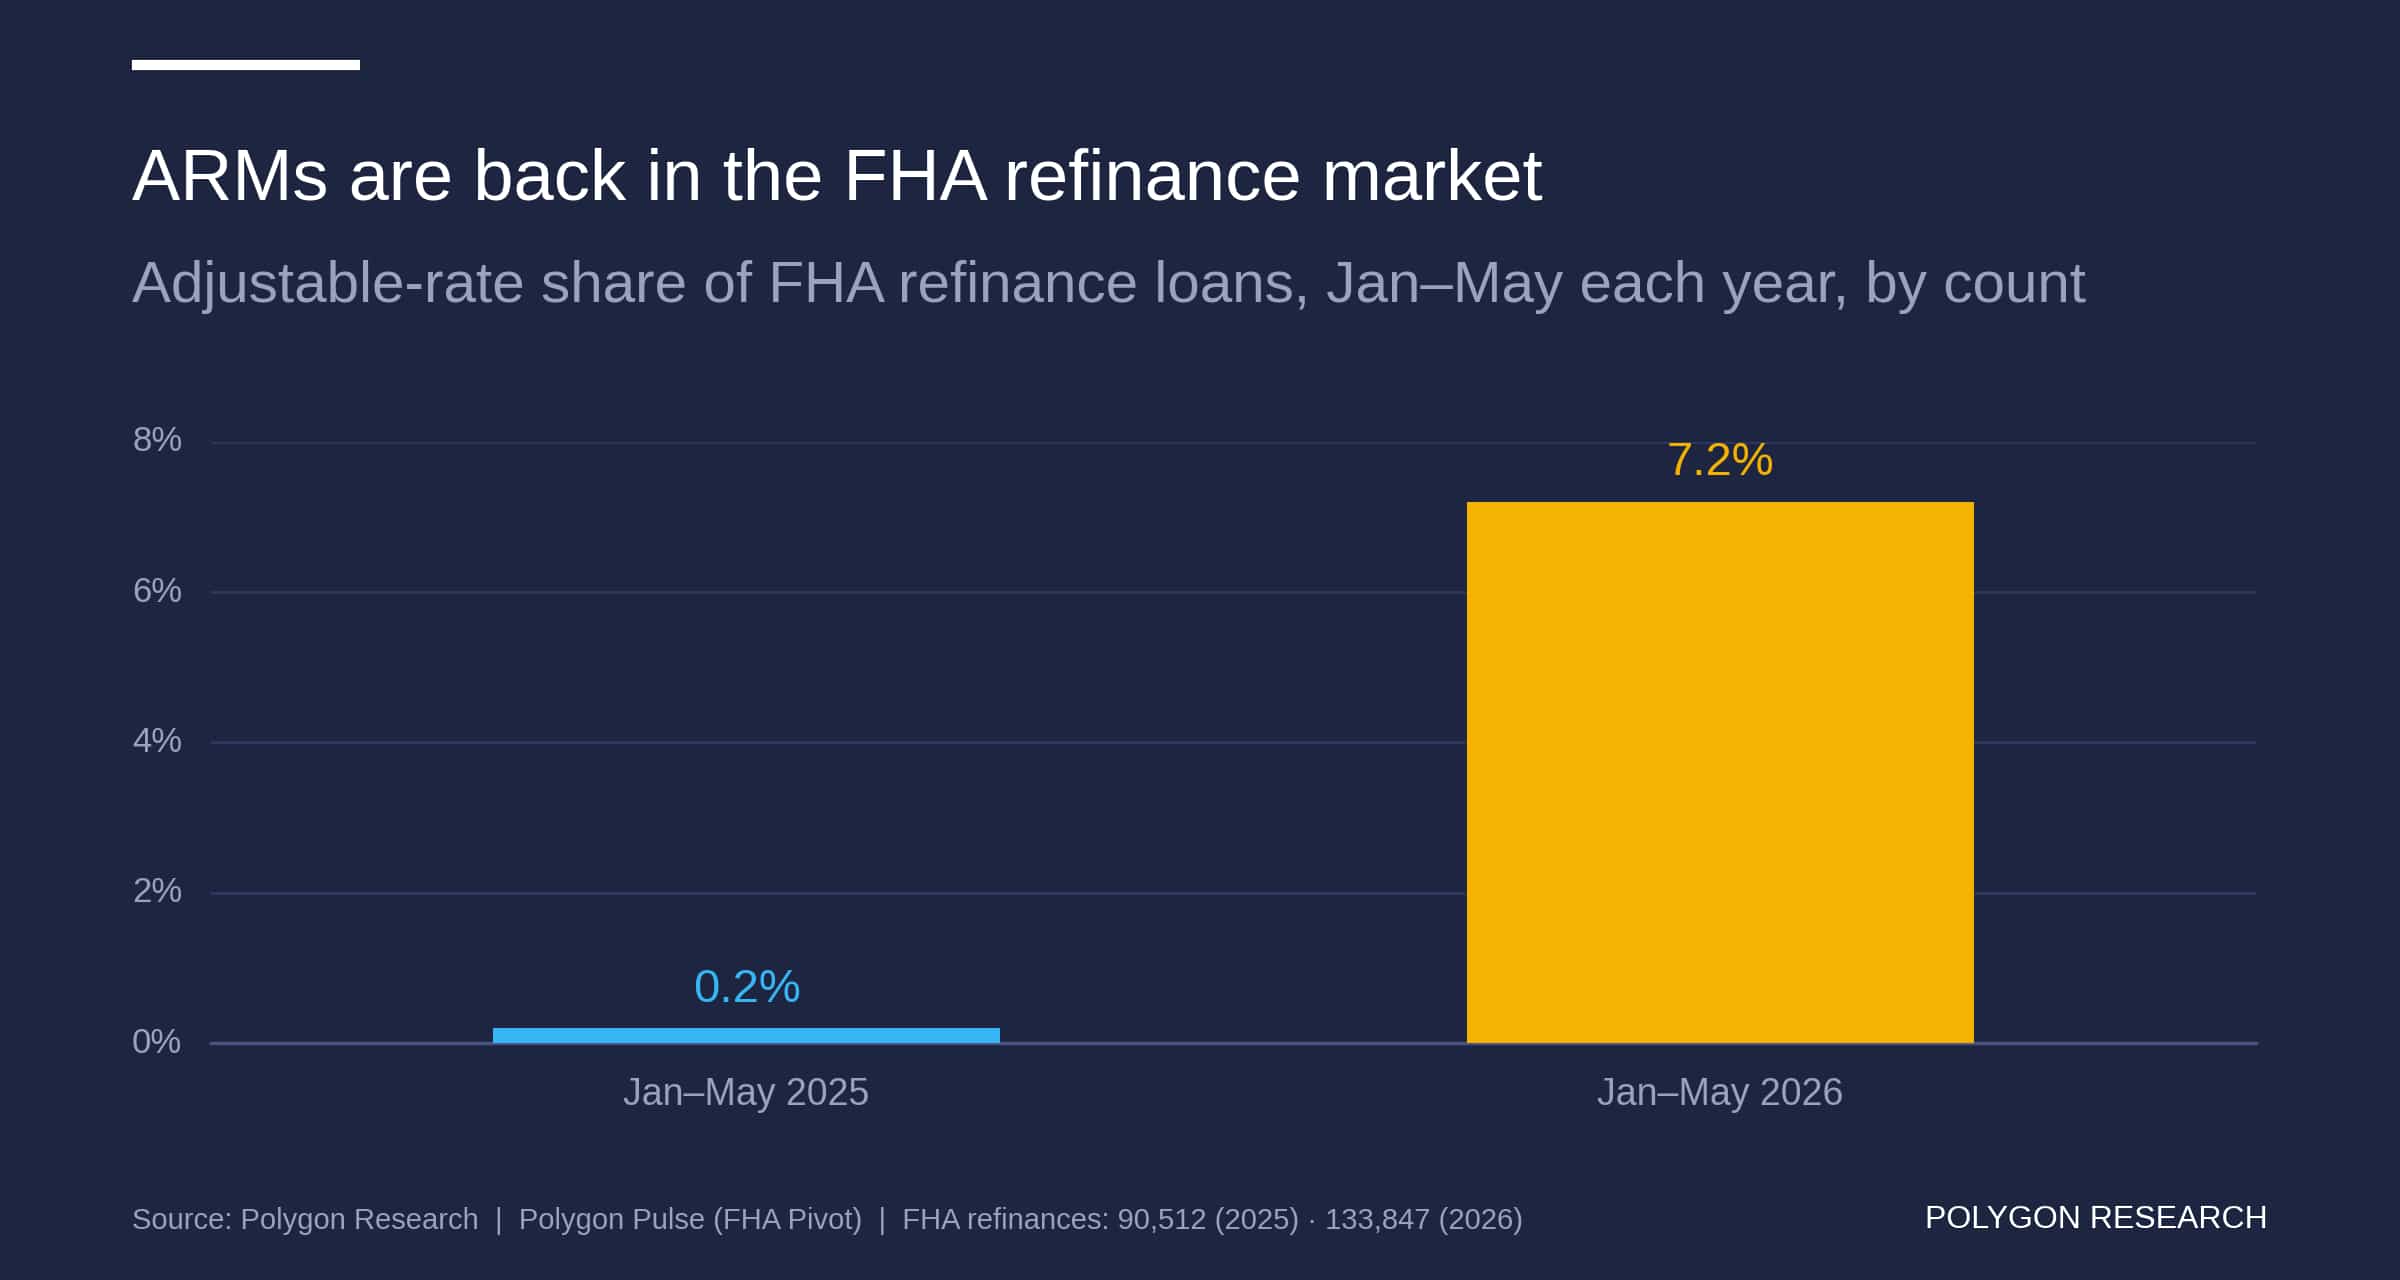
Bar chart showing FHA refinance ARM share rising from 0.2% in Jan–May 2025 to 7.2% in Jan–May 2026
Chart Download and Page Share

Share or Download

Data Points
Chart Topic | FHA adjustable-rate refinance loan share Measurement | Adjustable-rate share of FHA refinance loans by loan count Comparison Window | January through May of each year Period | Adjustable-rate share of FHA refinance loans, by count | Total FHA refinance loan count Jan–May 2025 | 0.2% | 90,512 loans Jan–May 2026 | 7.2% | 133,847 loans Unit Note | ARM share is expressed as a percentage; FHA refinance volume is expressed as loan count Comparability Note | Both periods cover January through May, but each percentage is calculated from a different annual loan population
How common are ARMs in FHA refinancing?
ARMs were 7.2% of FHA refinance loans by count in Jan–May 2026.
Date Published:
July 12, 2026
Date Updated:
July 13, 2026
Chart type:
Bar Chart
Suggested Citation:
Polygon Research, “Adjustable-Rate Share of FHA Refinance Loans by Count: 2025 vs. 2026,” Polygon Pulse (FHA Pivot), updated July 2026. Data through May 2026. Scope: FHA refinance loans; comparison periods Jan–May 2025 and Jan–May 2026. Metric: adjustable-rate share by FHA loan count. Accessed July 12, 2026.
Key insights

ARMs represented 7.2% of FHA refinance loans by count in Jan–May 2026, up from 0.2% during the same period in 2025. FHA refinance volume also increased, from 90,512 loans to 133,847, so the shift reflects a larger ARM share within a larger refinance market. The shift also aligns with the broader return of adjustable-rate mortgages across the agency market, although the two analyses cover different loan populations.

For FHA lenders, the increase warrants a fresh review of ARM eligibility criteria, pricing strategy and loan-officer guidance as refinance conversations expand beyond traditional fixed-rate options. Servicers can use note rate, remaining term, borrower objectives and capacity for future payment changes to identify appropriate retention opportunities. Secondary-marketing teams should also confirm investor outlets, margins, pull-through assumptions and pipeline reporting before expanding FHA ARM refinance activity.

The chart does not show borrower savings, ARM structures, note-rate differences, or loan performance, and it does not indicate that an ARM is appropriate for any individual borrower. Both periods cover January through May, but each share is calculated from a different annual refinance population.

From Analysis to Action

This analysis provides a clear blueprint for how to uncover meaningful market dynamics. Its true power is unleashed when you apply this same methodology to your own local markets. Because all real estate is local, this granular approach is essential for crafting precise strategies that effectively address the unique conditions of each community.

Ready to Continue? Get Your Exact Market Answers.

Go beyond generic insights. Polygon's interactive tools and limitless filtering empower you to tailor market data to your specific strategy.
Start your 7-day free trial.
Unlock My Custom Insights Now - Free Trial