Manufactured Home Property Values by State
Mortgage Markets
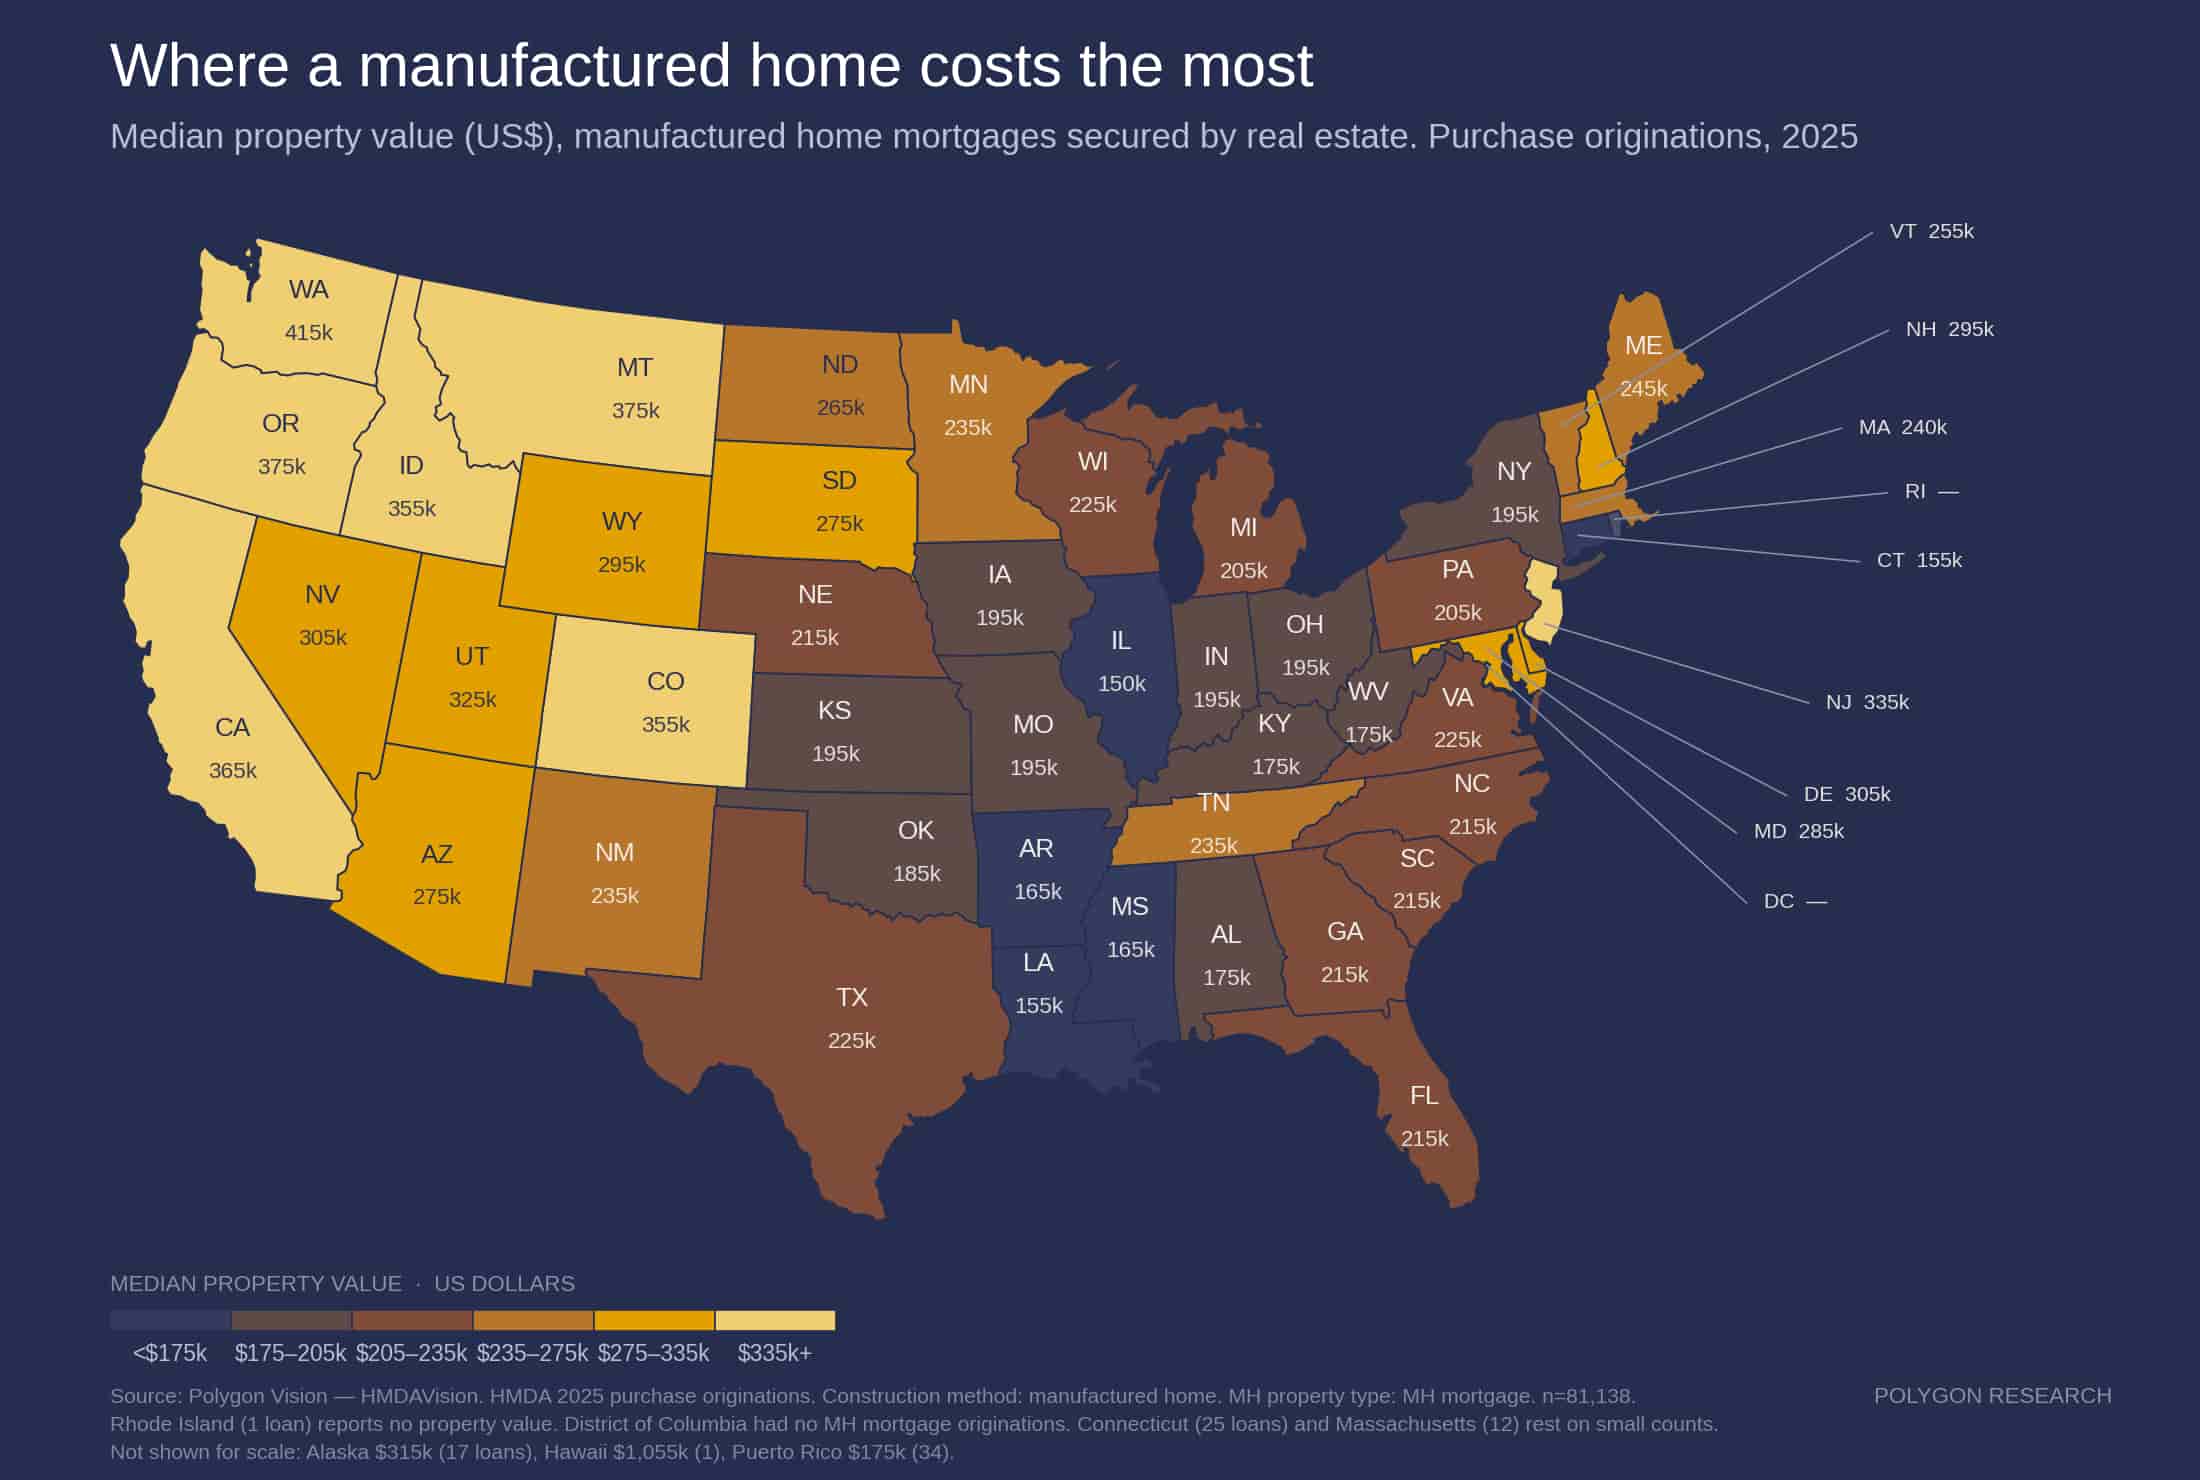
U.S. map of 2025 median property values for manufactured home purchase mortgages secured by real estate; Washington is highest at $415,000.
Chart Download and Page Share

Share or Download

Data Points
Scope | Purchase originations | 2025 Construction method | Manufactured home MH property type | MH mortgage Security | Secured by real estate Metric | Median property value | US dollars Originations | n=81,138 WA | $415,000 OR | $375,000 CA | $365,000 NV | $305,000 ID | $355,000 MT | $375,000 WY | $295,000 UT | $325,000 AZ | $275,000 NM | $235,000 CO | $355,000 ND | $265,000 SD | $275,000 NE | $215,000 KS | $195,000 OK | $185,000 TX | $225,000 MN | $235,000 IA | $195,000 MO | $195,000 AR | $165,000 LA | $155,000 WI | $225,000 IL | $150,000 MS | $165,000 MI | $205,000 IN | $195,000 OH | $195,000 KY | $175,000 TN | $235,000 AL | $175,000 GA | $215,000 FL | $215,000 SC | $215,000 NC | $215,000 VA | $225,000 WV | $175,000 PA | $205,000 NY | $195,000 ME | $245,000 VT | $255,000 NH | $295,000 RI | — NJ | $335,000 DE | $305,000 MD | $285,000 DC | — Map note | Alaska, Hawaii and Puerto Rico | Omitted for scale
Where are manufactured homes most expensive?
Washington leads at a $415,000 median property value; Oregon and Montana follow at $375,000.
Date Published:
August 6, 2026
Date Updated:
August 6, 2026
Chart type:
Map
Suggested Citation:
Polygon Research, “Median Property Value by State for Real Estate-Secured Manufactured Home Mortgages: 2025 Purchases,” Polygon Vision — HMDAVision, published August 2026. Data through 2025. Scope: U.S. 2025 purchase originations; construction method: manufactured home; MH property type: MH mortgage; secured by real estate; n=81,138. Alaska, Hawaii and Puerto Rico omitted for scale. Metric: median property value (US$). Accessed August 6, 2026.
Key insights

Washington leads at a $415,000 median property value; Illinois is lowest at $150,000. This map plots the 81,138 HMDA-reported 2025 purchase originations for manufactured home mortgages secured by real estate. It does not measure the wider manufactured housing market, chattel loans or home-only prices.

6.6 million households live in manufactured homes, but only 37.3% of buyers finance the purchase with a mortgage; the other 62.7% pay cash (CensusVision). Pull-through on real-estate-secured applications is 36.4%. On chattel loans it stays under 17.5% (HMDAVision).

Values run highest across the West. At the lower end, Louisiana is $155,000, Arkansas and Mississippi $165,000, and Alabama, Kentucky and West Virginia $175,000, where smaller-balance production economics warrant attention, as in rural small-balance manufactured home lending.

Manufactured housing was also the only property type with more conventional first-time buyer purchases in 2025 than in 2018, rising 30.5% while every other type declined. Its cost advantage is narrowing fastest: average loan amounts grew 55.8% over the same period.

Alaska, Hawaii and Puerto Rico are omitted for scale. To work with the underlying data directly, explore HMDAVision.

From Analysis to Action

This analysis provides a clear blueprint for how to uncover meaningful market dynamics. Its true power is unleashed when you apply this same methodology to your own local markets. Because all real estate is local, this granular approach is essential for crafting precise strategies that effectively address the unique conditions of each community.

Ready to Continue? Get Your Exact Market Answers.

Go beyond generic insights. Polygon's interactive tools and limitless filtering empower you to tailor market data to your specific strategy.
Start your 7-day free trial.
Unlock My Custom Insights Now - Free Trial