First-Time Homebuyers in 2026: 60% of Agency Purchase Loans and What Comes Next

First-time homebuyers have not disappeared from the mortgage market. In the first half of 2026, they accounted for 60.3% of purchase loans delivered to Fannie Mae, Freddie Mac, and Ginnie Mae: 530,048 of 879,214 loans.
60.3% of purchase mortgages went to first-time homebuyers year-to-date 2026 through June.
That result looks incompatible with survey estimates that place the first-time-buyer share closer to one in five. It is not. The two figures answer different questions.
Surveys of all home purchase transactions include cash transactions, which are more common among repeat buyers and investors. Agency loan data describes financed purchases in the conventional and government product segments. For lenders, servicers, and capital-markets teams, that is the market for underwriting and execution.
The distinction matters because a share can be both accurate and easy to misread. First-time homebuyers can take a larger share when repeat buyers retreat, even if total purchase volume remains weak. A 60% share shows that first-time homebuyers have become the central source of purchase mortgage demand.
The category itself is broader than the phrase suggests. In most agency and government programs, a first-time homebuyer is someone who has not held an ownership interest in a principal residence during the previous three years. Some programs also include displaced homemakers and single parents who previously owned only with a spouse. As we have written before, the answer depends partly on who is doing the counting.
A majority of financed buyers, but not an easy market
The average first-time buyer in the first half of 2026 borrowed $339,695 at 5.93%, with a 91% loan-to-value ratio and a 40.1% debt-to-income ratio. The average repeat buyer borrowed $388,470 at 5.99%, with an 80% LTV and a 39.7% DTI. Repeat buyers also carried an average credit score of 754, compared with 726 for first-time buyers.

The lower average note rate for first-time buyers is not evidence that lenders priced thinner files more favorably. It reflects product mix. Government execution accounted for 48.8% of first-time-buyer purchase loans, and the average 30-year FHA fixed rate was 5.85%, compared with 6.10% for the conventional equivalent.
That creates two markets inside one label. One is conventional and exposed to credit-based pricing adjustments. The other is government-backed and shaped by a different pricing and insurance structure. Portfolio, margin, and product analysis should not average the two together and assume the result describes either one.
The age profile also challenges a familiar narrative. Our First-Time Homebuyer Age Trends analysis puts the median at 36, down one year since 2018. Over the same period, the under-25 share rose from 8.2% to 10.5%, while the 35-to-44 share contracted.
This does not mean younger households face fewer barriers. It means the buyers who reached closing in this segment were not steadily aging. The distinction between people who want to buy and those who successfully finance a purchase remains essential.
Property type is reshaping the entry-level market
Condominiums remain an important path into ownership, although the longer trend is broader than the condo market. In the first half of 2026, condos accounted for 10.8% of conventional first-time-buyer purchases delivered to Fannie Mae and Freddie Mac. These borrowers had the strongest average credit score in the conventional book—760—and a smaller average loan than buyers of detached single-family homes or planned unit developments.
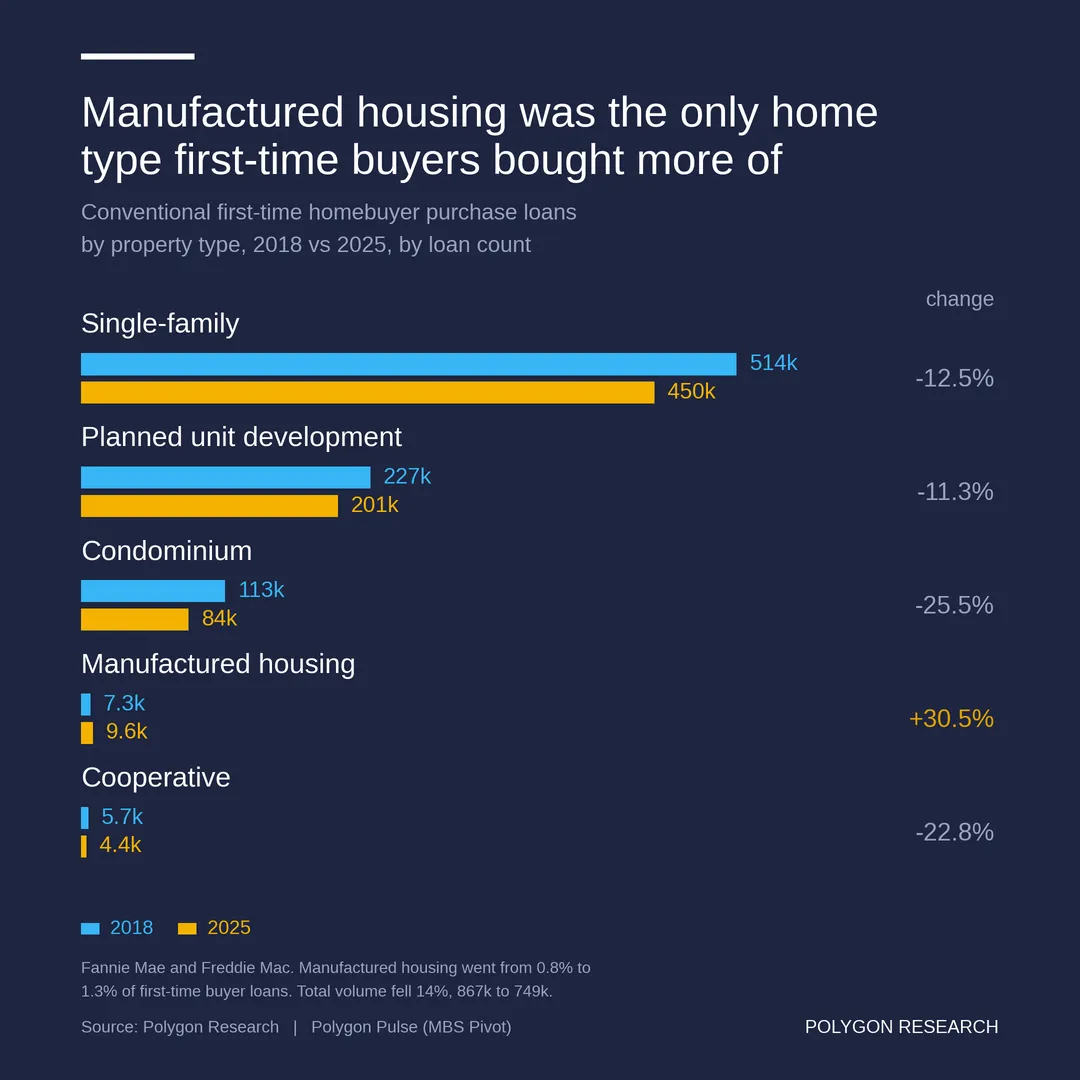
The 2018-to-2025 history adds essential context. Conventional first-time-buyer purchase volume across all property types declined 14%, from approximately 867,000 loans to 749,000. Condo purchases fell from 113,000 to 84,000, a 25.5% reduction. Single-family volume declined 12.5%, planned unit developments 11.3%, and cooperatives 22.8%.
Manufactured housing moved in the opposite direction. Loan count rose from 7,300 to 9,600, a 30.5% increase, and its share of conventional first-time-buyer purchases rose from 0.8% to 1.3%. The category remains small, but it was the only property type in the analysis with more first-time-buyer loans in 2025 than in 2018.
The financing amounts tell a second part of the story. Manufactured housing remained the lowest-balance option in 2025, with an average loan of $217,000. That compared with $319,000 for condominiums, $331,000 for single-family homes, and $391,000 for planned unit developments. Yet manufactured-housing loan amounts grew faster than those of any other property type, rising 55.8% since 2018. Condo loan amounts rose 43.4% over the same period.
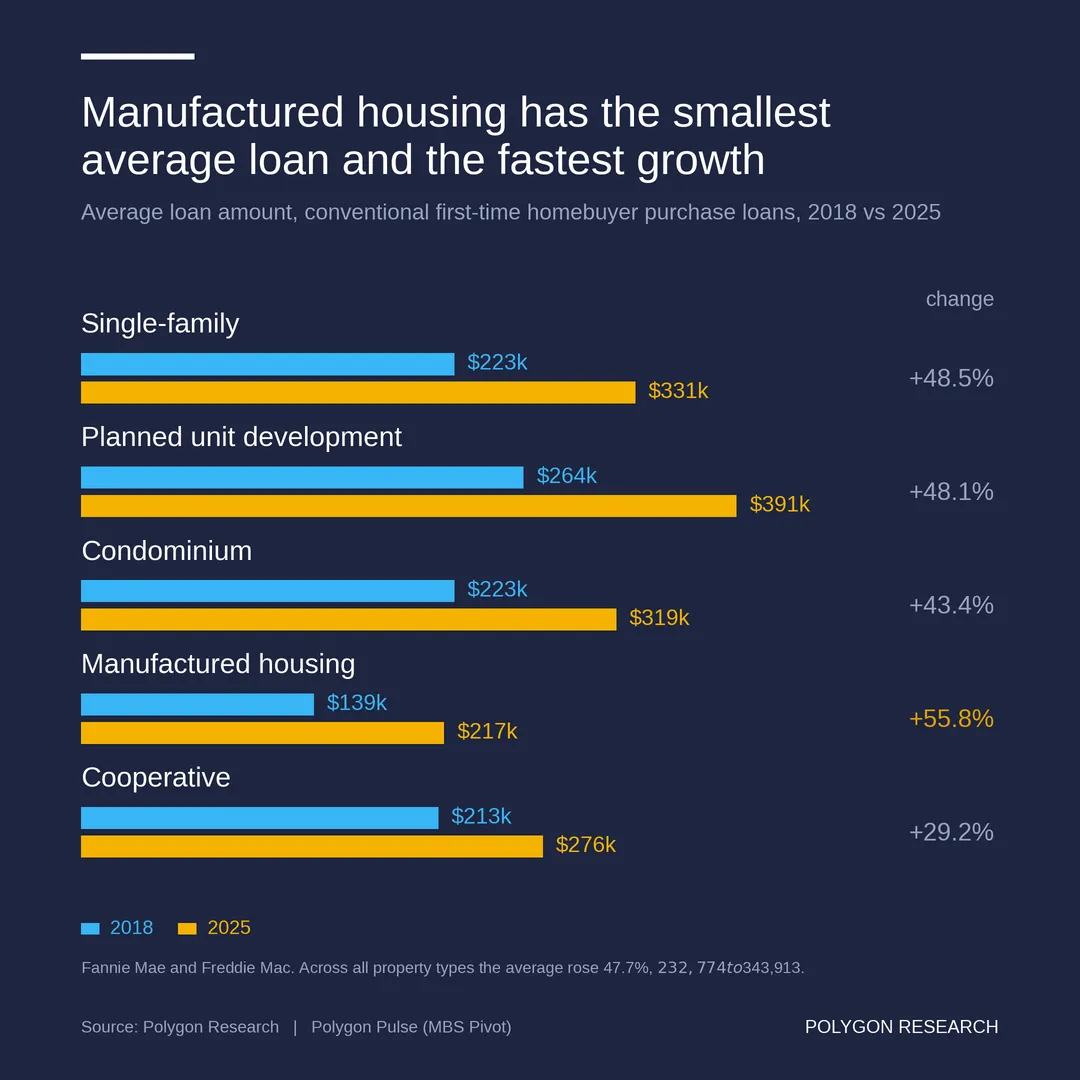
These patterns complicate the idea of a single starter-home channel. Condo volume has contracted sharply even though the product serves strong-credit borrowers at relatively lower balances. Project eligibility, property insurance, HOA reserves, deferred maintenance, investor concentration, and related project rules can reduce the inventory that qualifies for conventional execution. Manufactured housing is expanding from a small base while its affordability advantage is narrowing quickly.
For lenders, property type is a market-development question. One county may have first-time-buyer demand without enough financeable condominiums. Another may have manufactured-housing demand but limited product coverage, land-tenure compatibility, or local distribution. The practical opportunity becomes clearer when borrower demand, property stock, and financing rules are examined together.
For housing organizations and policymakers, unit counts alone provide an incomplete measure of access. The relevant supply is the set of homes that buyers can both afford and finance through the channels available to them.
First-time homebuyer opportunity is local
First-time-buyer activity is concentrated, but the market profile changes sharply by geography. Texas, Florida and California together accounted for more than one in four first-time-buyer agency purchase loans in the first half of 2026. Yet average loan amounts ranged from about $307,000 in Texas to $537,000 in California. Those are very different markets behind the same national label.
Volume is only the first layer. Average leverage, credit profile, product mix and pricing vary by state, and state averages can mask even sharper differences among metros and counties. The practical question for lenders is where first-time-buyer demand aligns with local household income, financeable inventory, product coverage and competitive position.
National projections provide planning context. Local segmentation shows where product, distribution and partnership strategies may need to differ.
Three paths for first-time-homebuyer volume in 2026
January through April produced 430,571 first-time-homebuyer purchase loans. May and June are still maturing in the agency disclosures because loans appear only after securitization, while the first four months are effectively complete.
Rather than turn incomplete months into a precise forecast, we applied three second-half patterns the market has already produced. The result is a full-year range of 1.38 million to 1.52 million first-time-buyer agency purchase loans, with a central case of 1.45 million.
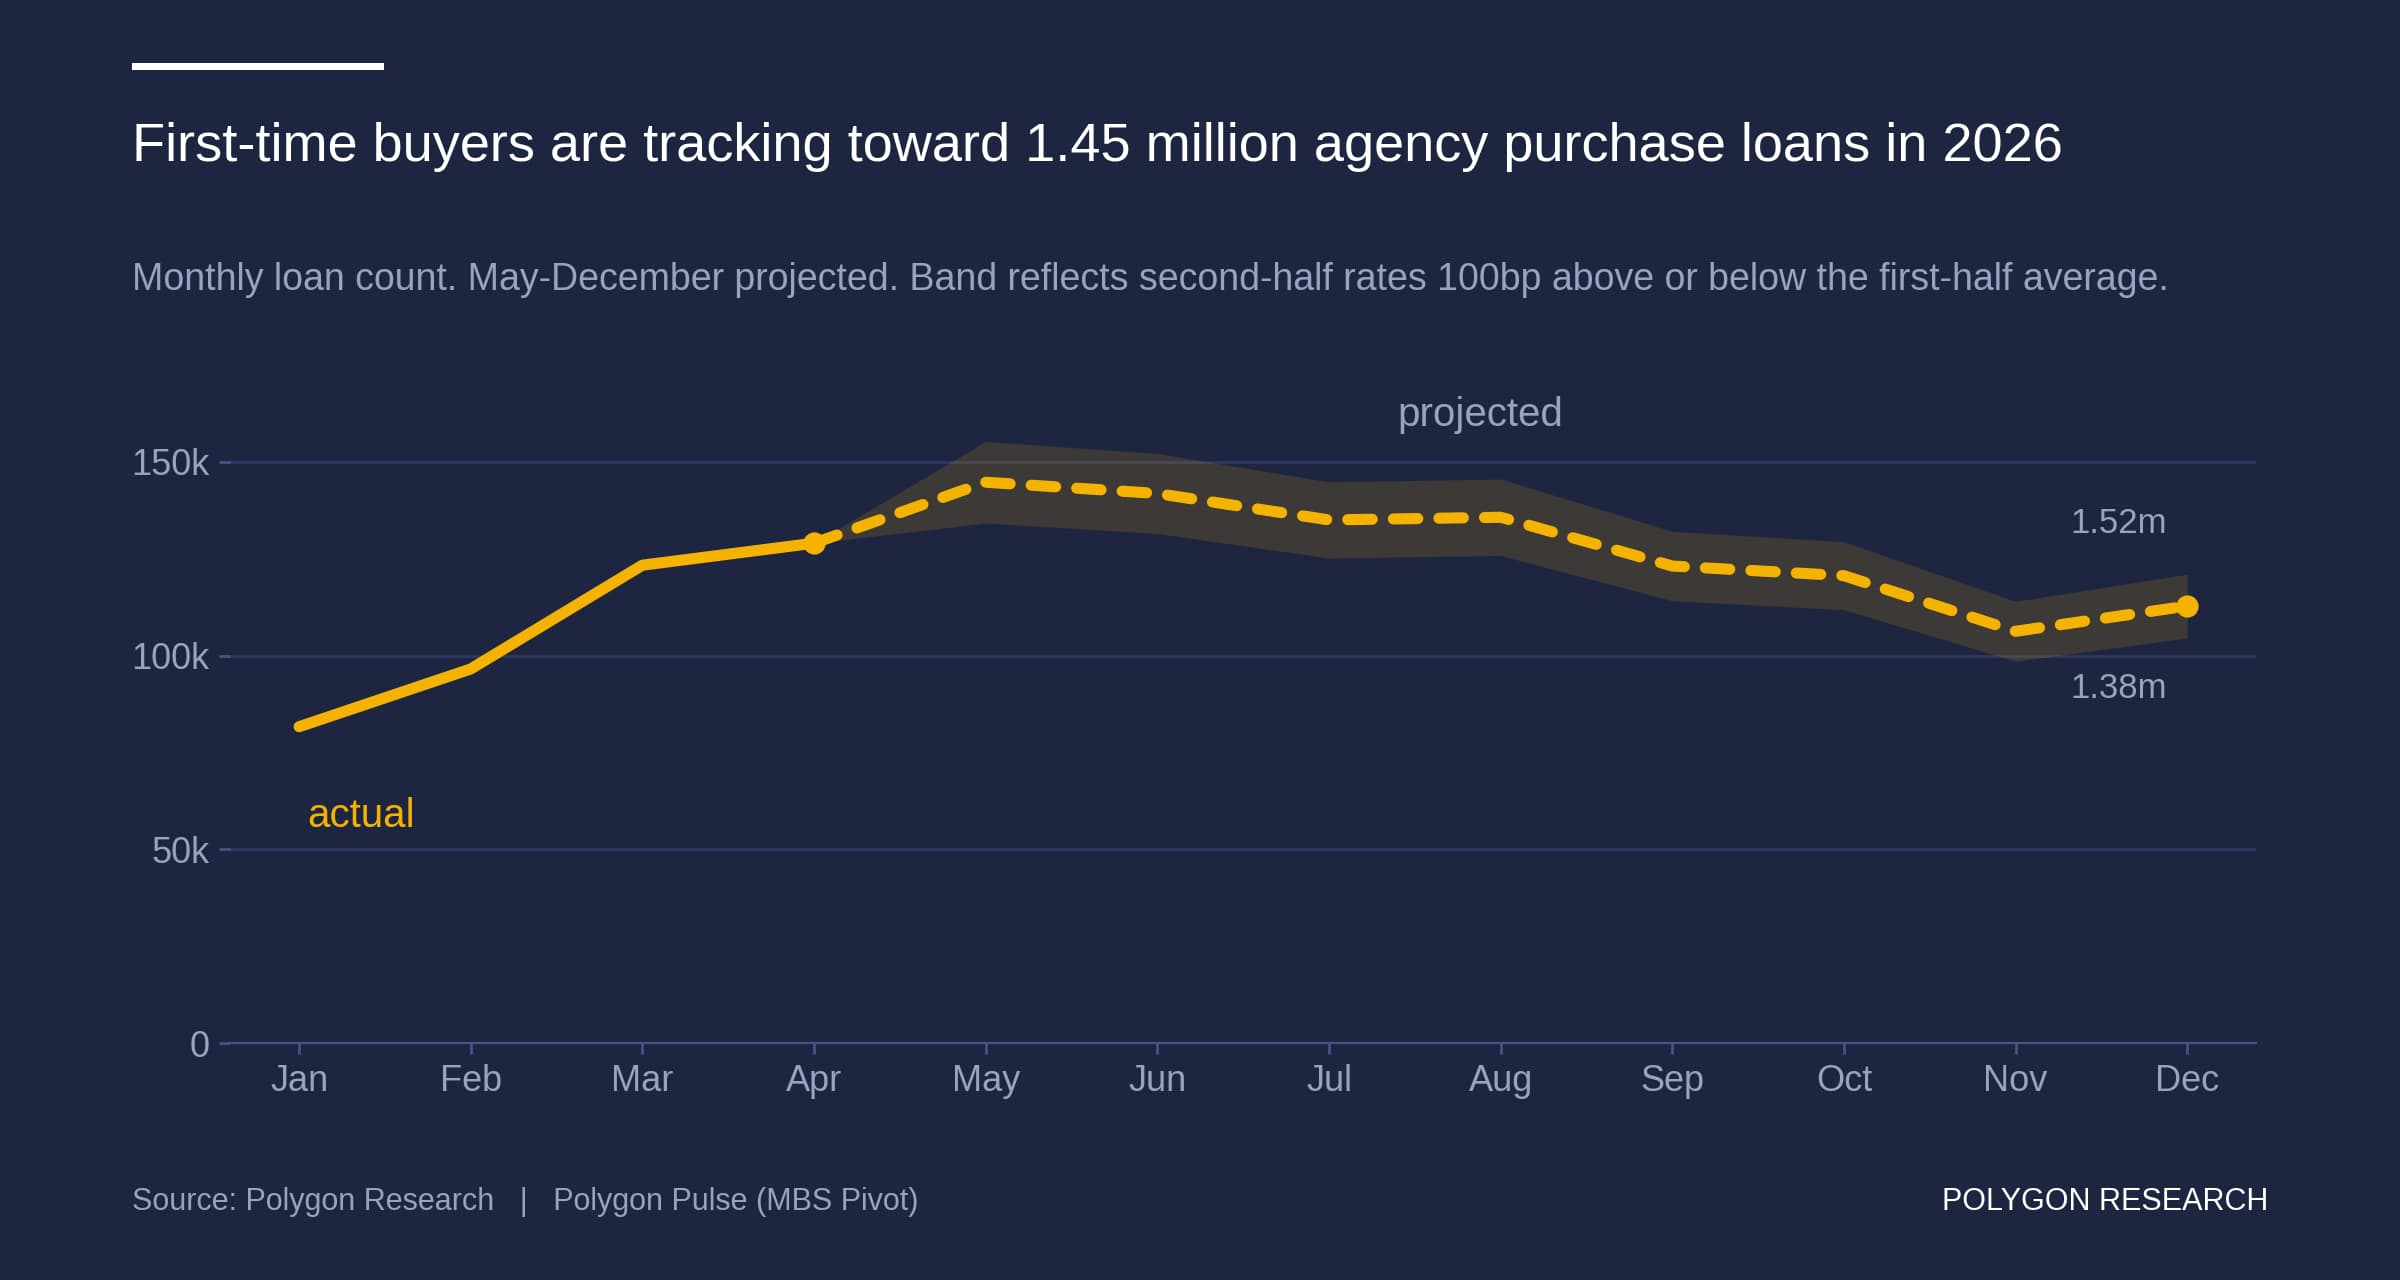
How 2026 finishes depends on rates. Since 2018, the only years when second-half volume came in below the first half were years when rates rose between the halves, and the larger the increase the larger the shortfall. In 2022, when the average rate rose about 150 basis points, the second half ran 15% below the first. In years when rates held steady or eased, the second half came in level with the first or slightly ahead.
The first half of 2026 averaged 5.93%. If the second half holds near that, the year finishes at about 1.45 million first-time buyer agency purchase loans, or roughly $493 billion. A 100 basis point move up would put it closer to 1.38 million, and the same move down closer to 1.52 million.
Where will the future buyers come from
The longer-term pipeline is considerably larger.
CensusVision identifies:
- 10.2 million Gen Z households, approximately 76% of which rent. About 9 million Gen Z households are in the labor force with a median annual household income of $62,000. About 6.8 million Gen Z households are renters with a median income of $57,000.
- 36.4 million Millennial households, approximately 44.9% of which rent. Millennial Renter households, in labor force, are 14.5 million with an annual household income of $70,000.
Together, these cohorts represent a large pool of potential future first-time buyers. But the number that converts into mortgage demand will depend on local affordability, local household income, local employment, credit readiness, available inventory and overall local market conditions.
What will determine the path
First-time-homebuyer share is likely to remain at or above 60% of agency purchase originations through 2026.
Mortgage rates will matter, but so will the response of inventory. More listings do not help equally if the available homes sit outside first-time-buyer price points or fail project-level eligibility tests. Government execution will remain important because it supports nearly half of the segment and helps explain its pricing. Insurance and HOA costs can change affordability even when the note rate does not. Local labor markets, property types, and product availability will determine where national momentum translates into closings.
More than half of the first-time homebuyers closed loans without a second borrower on the note. We analyzed the distribution of first-time-homebuyer loans by FICO and CLTV bucket.
These details describe a market split across strong-credit conventional borrowers, highly leveraged government borrowers, solo purchasers, and local supply systems that treat property types differently.
The question for the second half is whether lenders, builders, policymakers, and housing organizations will respond to the buyers who are actually reaching the market.
That response should be local. A national share cannot tell a lender which counties are gaining younger buyers, where government execution is doing most of the work, which peer institutions are winning, or whether condo eligibility is suppressing an otherwise viable market. Those decisions require the first-time-buyer profile to be connected with geography, product, property, borrower, and competitive context.
Start a complimentary trial to examine these same measures for your markets, peer group, and portfolio before the second-half plan is fixed.
Methodology. This analysis uses Fannie Mae, Freddie Mac, and Ginnie Mae loan-level disclosures modeled in MBS Pivot. It includes purchase loans only and uses the first-time-homebuyer flag reported by the originating lender. January through April 2026 loan counts are treated as actual. May and June are adjusted for securitization and disclosure lag to estimate a full first-half total of 715,839 first-time-homebuyer agency purchase loans. The second-half scenarios are based on the historical relationship between changes in average mortgage rates from the first half to the second half of the year and the corresponding second-half-to-first-half pattern in first-time-homebuyer agency purchase activity. The historical comparison covers 2018 through 2025, excluding 2020 because pandemic-era market disruptions made that year unrepresentative of normal seasonal patterns. The central scenario assumes that average second-half mortgage rates remain near the first-half 2026 average of 5.93%.The low scenario assumes that average second-half mortgage rates are 100 basis points above the first-half average. The high scenario assumes that average second-half mortgage rates are 100 basis points below the first-half average. These scenarios illustrate how annual loan activity could differ under three rate environments. They are not predictions of future mortgage rates or precise forecasts of annual loan volume. Full-year origination-volume estimates use the first-half 2026 average loan amount of $339,695.Analysis was completed in Polygon Pulse using MBS Pivot. Averages are loan-count weighted. Property-type analysis covers Fannie Mae and Freddie Mac only because Ginnie Mae does not report property type at the same level of detail. Age analysis uses HMDA loan-level data with FHA purchase, first-lien, primary-residence, one-to-four-unit loans as a proxy because HMDA does not include a first-time-homebuyer flag. CensusVision statistics are based on Polygon Research analysis of American Community Survey data.
Related
Explore additional articles and market views:
- How first-time homebuyers are defined—and why estimates differ — compares survey findings with agency, HMDA, and Census data.
- First-Time Homebuyer Agency Loan Outlook — presents the monthly 2026 projection, seasonal pattern, and planning range.
- First-Time Homebuyer Age Trends: 2018 to 2025 — tracks the borrower age distribution using an HMDA-based FHA purchase proxy.
- First-Time Homebuyer Loan Mix — compares conventional volume with combined FHA, VA, and USDA activity.

